SAS-SCHULZ-MC2
VAST Challenge 2024
Challenge 2
Team Information
Team members:
- Falko Schulz, SAS Institute, Falko.Schulz@sas.com (PRIMARY)
- Steven Harenberg, SAS Institute, Steven.Harenberg@sas.com
- Brandon Reese, SAS Institute, Brandon.Reese@sas.com
- Amy Becker, SAS Institute, Amy.Becker@sas.com
Student team?
No
Analytics tools used:
- SAS® Visual Analytics
- SAS® Viya®
- Network Action Set from SAS® Visual Data Mining and Machine Learning
Approximately how many hours were spent working on this submission in total?
100 hours
May we post your submission in the Visual Analytics Benchmark Repository after VAST Challenge 2024 is complete?
Yes
Video
Questions
Question 1 | Question 2 | Question 3 | Question 4
FishEye analysts need your help to perform geographic and temporal analysis of the CatchNet data so they can prevent illegal fishing from happening again. Your task is to develop new visual analytics tools and workflows that can be used to discover and understand signatures of different types of behavior. Can you use your tool to visualize a signature of SouthSeafood Express Corp’s illegal behavior? FishEye needs your help to develop a workflow to find other instances of illegal behavior.
Note: the VAST challenge is focused on visual analytics and graphical figures should be included with your response to each question. Please include a reasonable number of figures for each question (no more than about 6) and keep written responses as brief as possible (around 250 words per question). Participants are encouraged to new visual representations rather than relying on traditional or existing approaches.
NOTE
The answer form contains interactive visualizations that rely on content hosted on GitHub pages and CDNs. If you encounter issues with these visualizations first try viewing in Chrome and disabling any ad blocking. Also make sure to access this form via a hosted link (http://...). If the interactive visuals still do not work a static fallback version can be forced by clicking this link:
1 FishEye analysts have long wanted to better understand the flow of commercially caught fish through Oceanus’s many ports. But as they were loading data into CatchNet, they discovered they had purchased the wrong port records. They wanted to get the ship off-load records, but they instead got the port-exit records (essentially trucks/trains leaving the port area). Port exit records do not include which vessel that delivered the products. Given this limitation, develop a visualization system to associate vessels with their probable cargos. Which vessels deliver which products and when? What are the seasonal trends and anomalies in the port exit records?
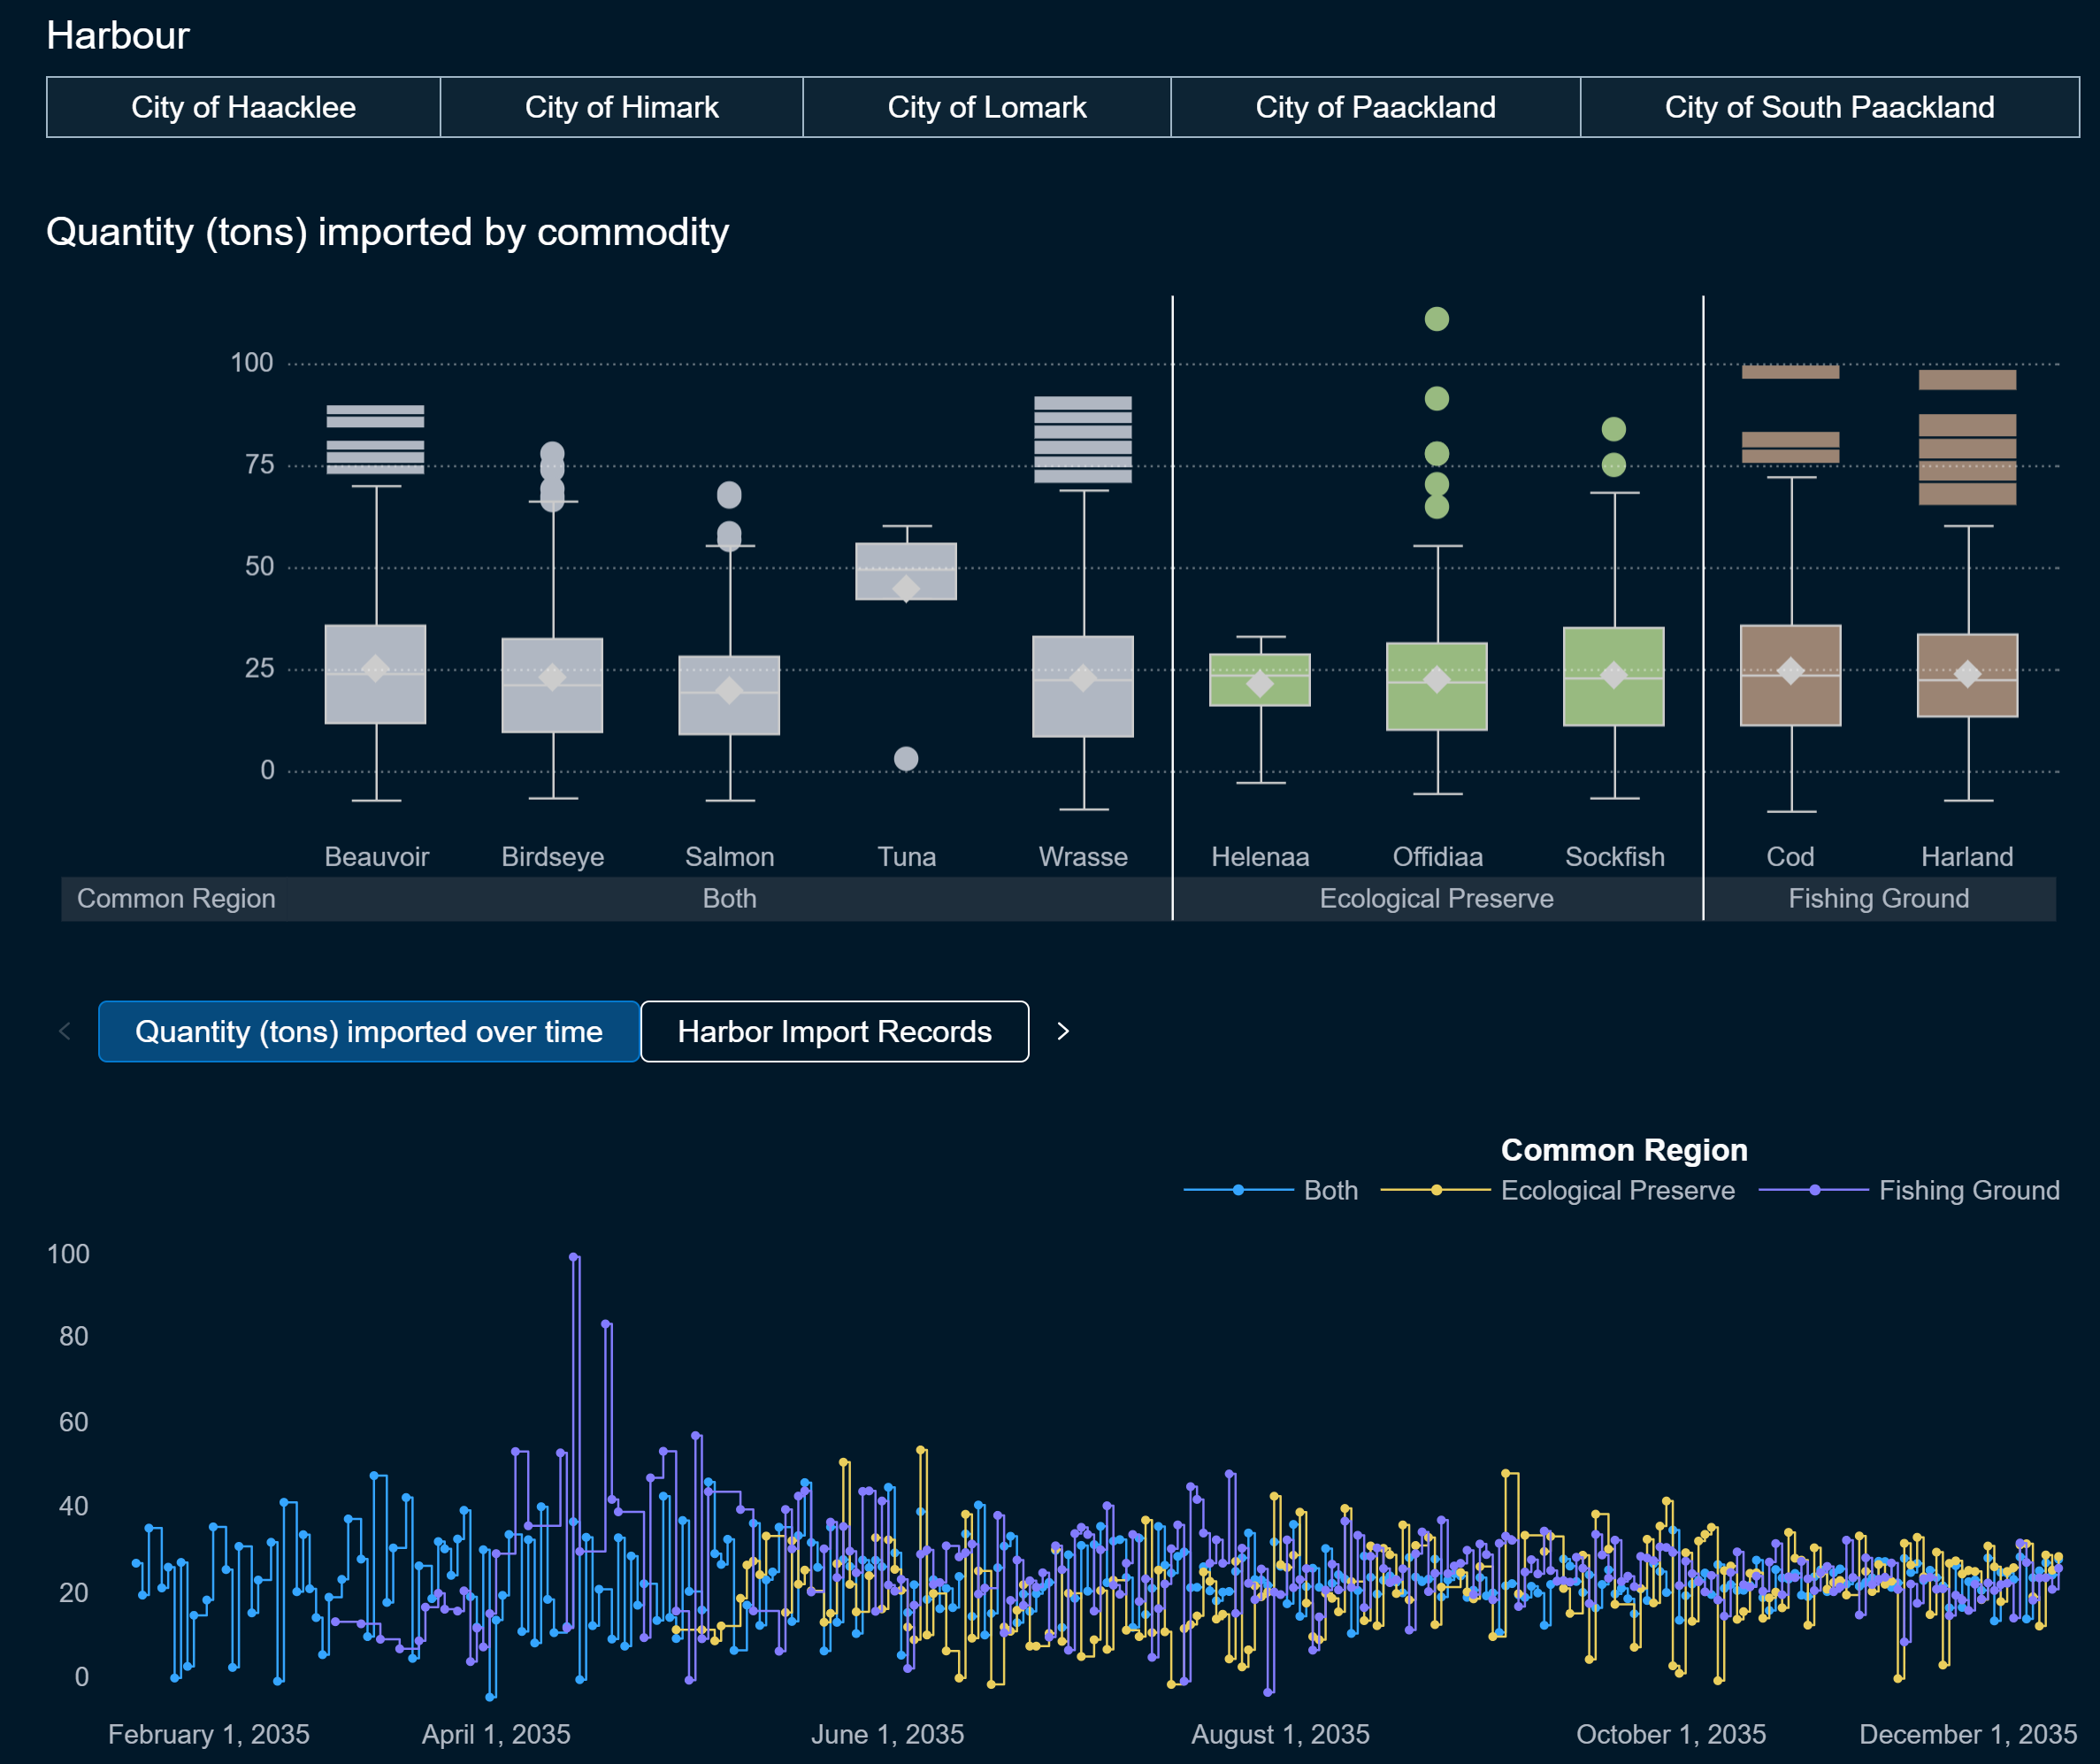
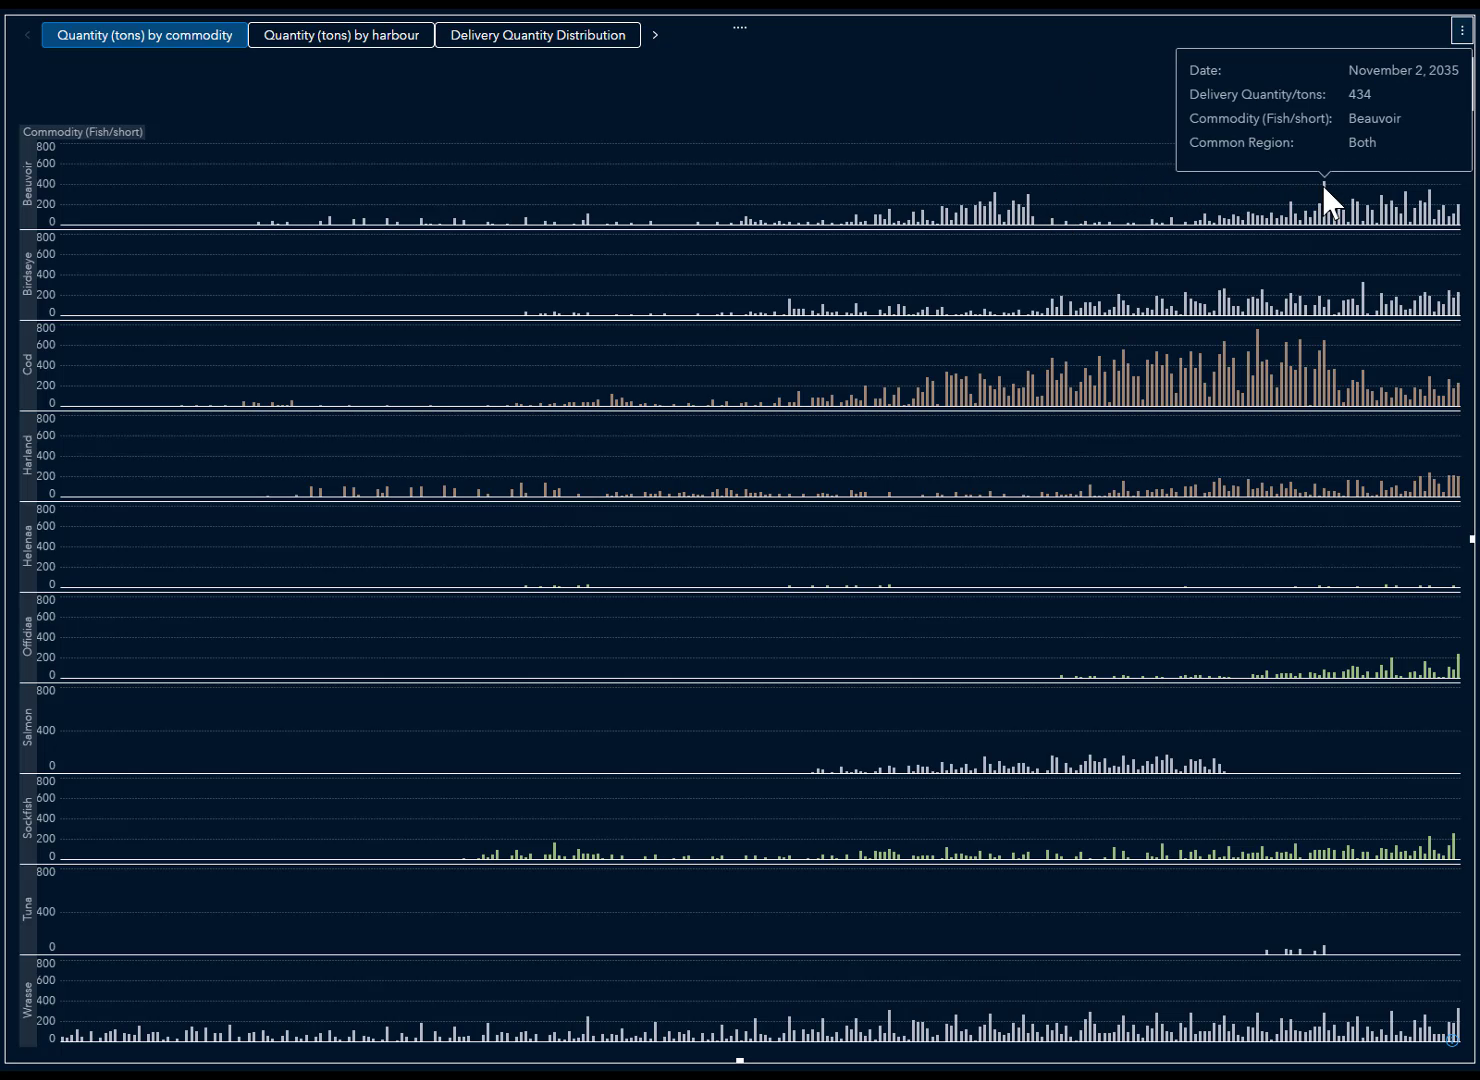
To better understand the flow of commercially caught fish through Oceanus, the team analyzed the cargo exports. The visualizations below provide insights into fishing seasons and harbor distribution. Interestingly, some fish species are exported only during very narrow time frames, such as Tuna, which is available only in late October. Additionally, we observe cargos exporting commodities exclusive to ecological preserves. Analyzing the distribution by harbor, we find that some, like Himark, are busy year-round, whereas others, such as Lomark and South Packland, show activity only in the second half of the year. Finally, a quantity distribution shows that we also have negative values recorded in the data. Further investigation may be required to determine the meaning of such values.
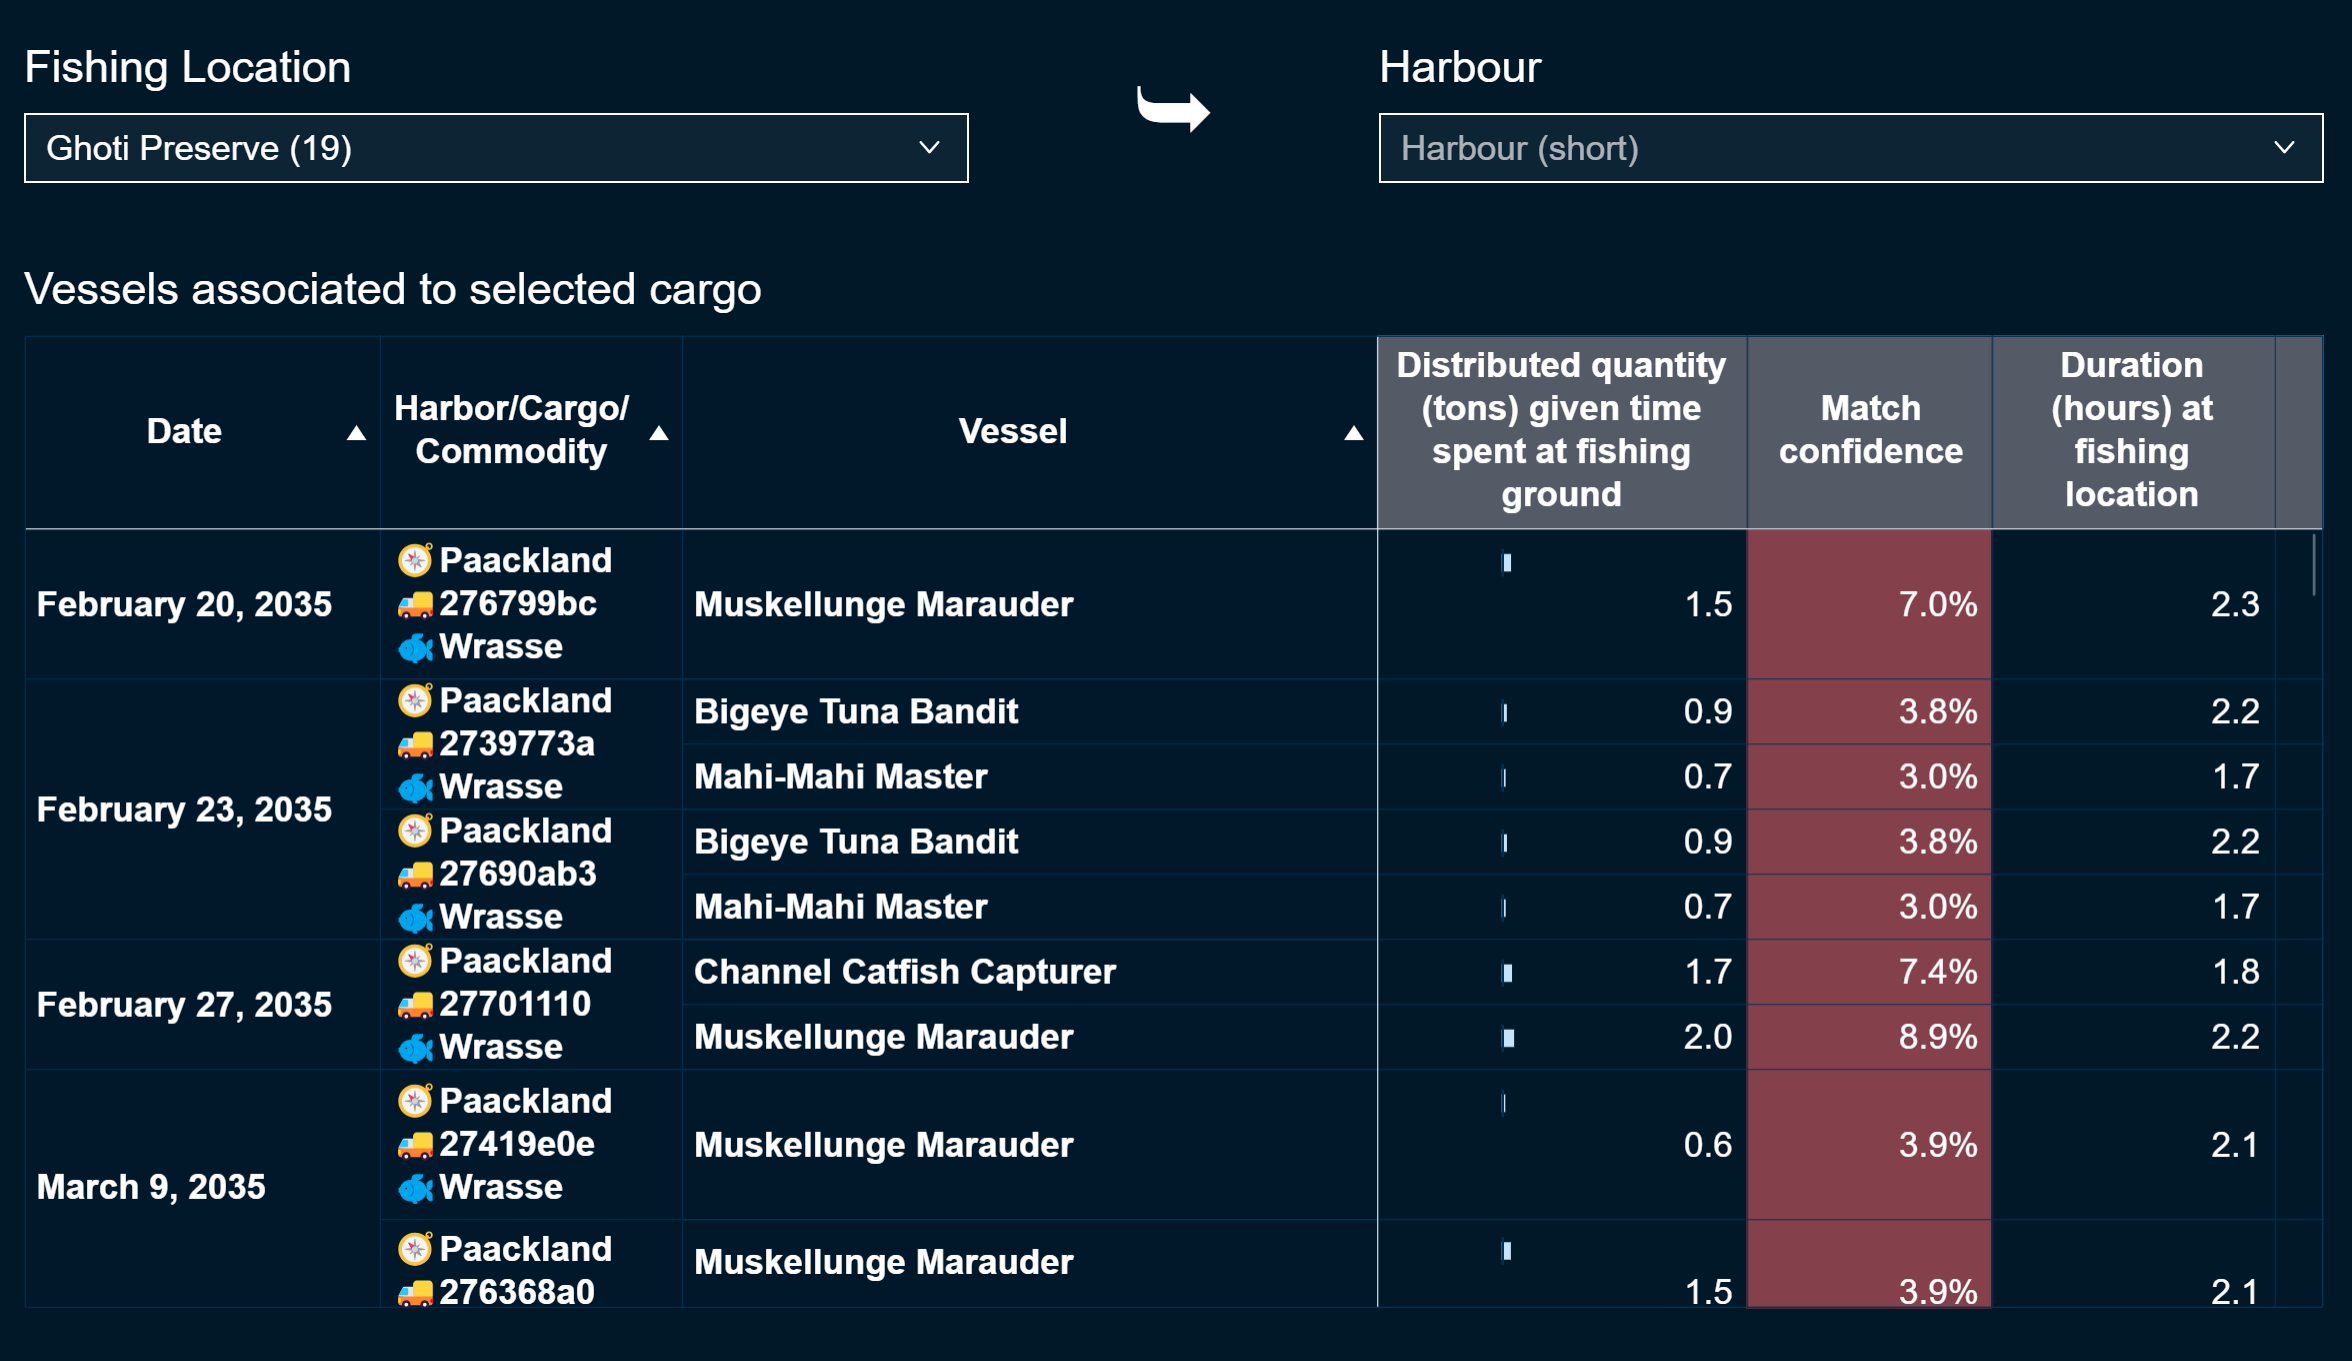
Given the travel details of each vessel and knowledge of their locations
in the hours prior to arriving at a harbor, we can identify which
vessels could have delivered a commodity on a specific day and time. By
considering the available fish species at the locations visited before
arriving at the harbor, we can further narrow down the list of potential
vessel matches.
The following visualizations display the overall confidence in
successful matches. A match confidence score is calculated based on the
number of vessels matched and related time spent at the sourcing fishing
ground. A high score indicates a low number of vessels associated with a
cargo, with 100% representing a 1:1 mapping. The analysis reveals that
we had higher confidence in the first half of the year, compared to the
second half, where multiple potential matches made it challenging to
determine exact vessel associations.
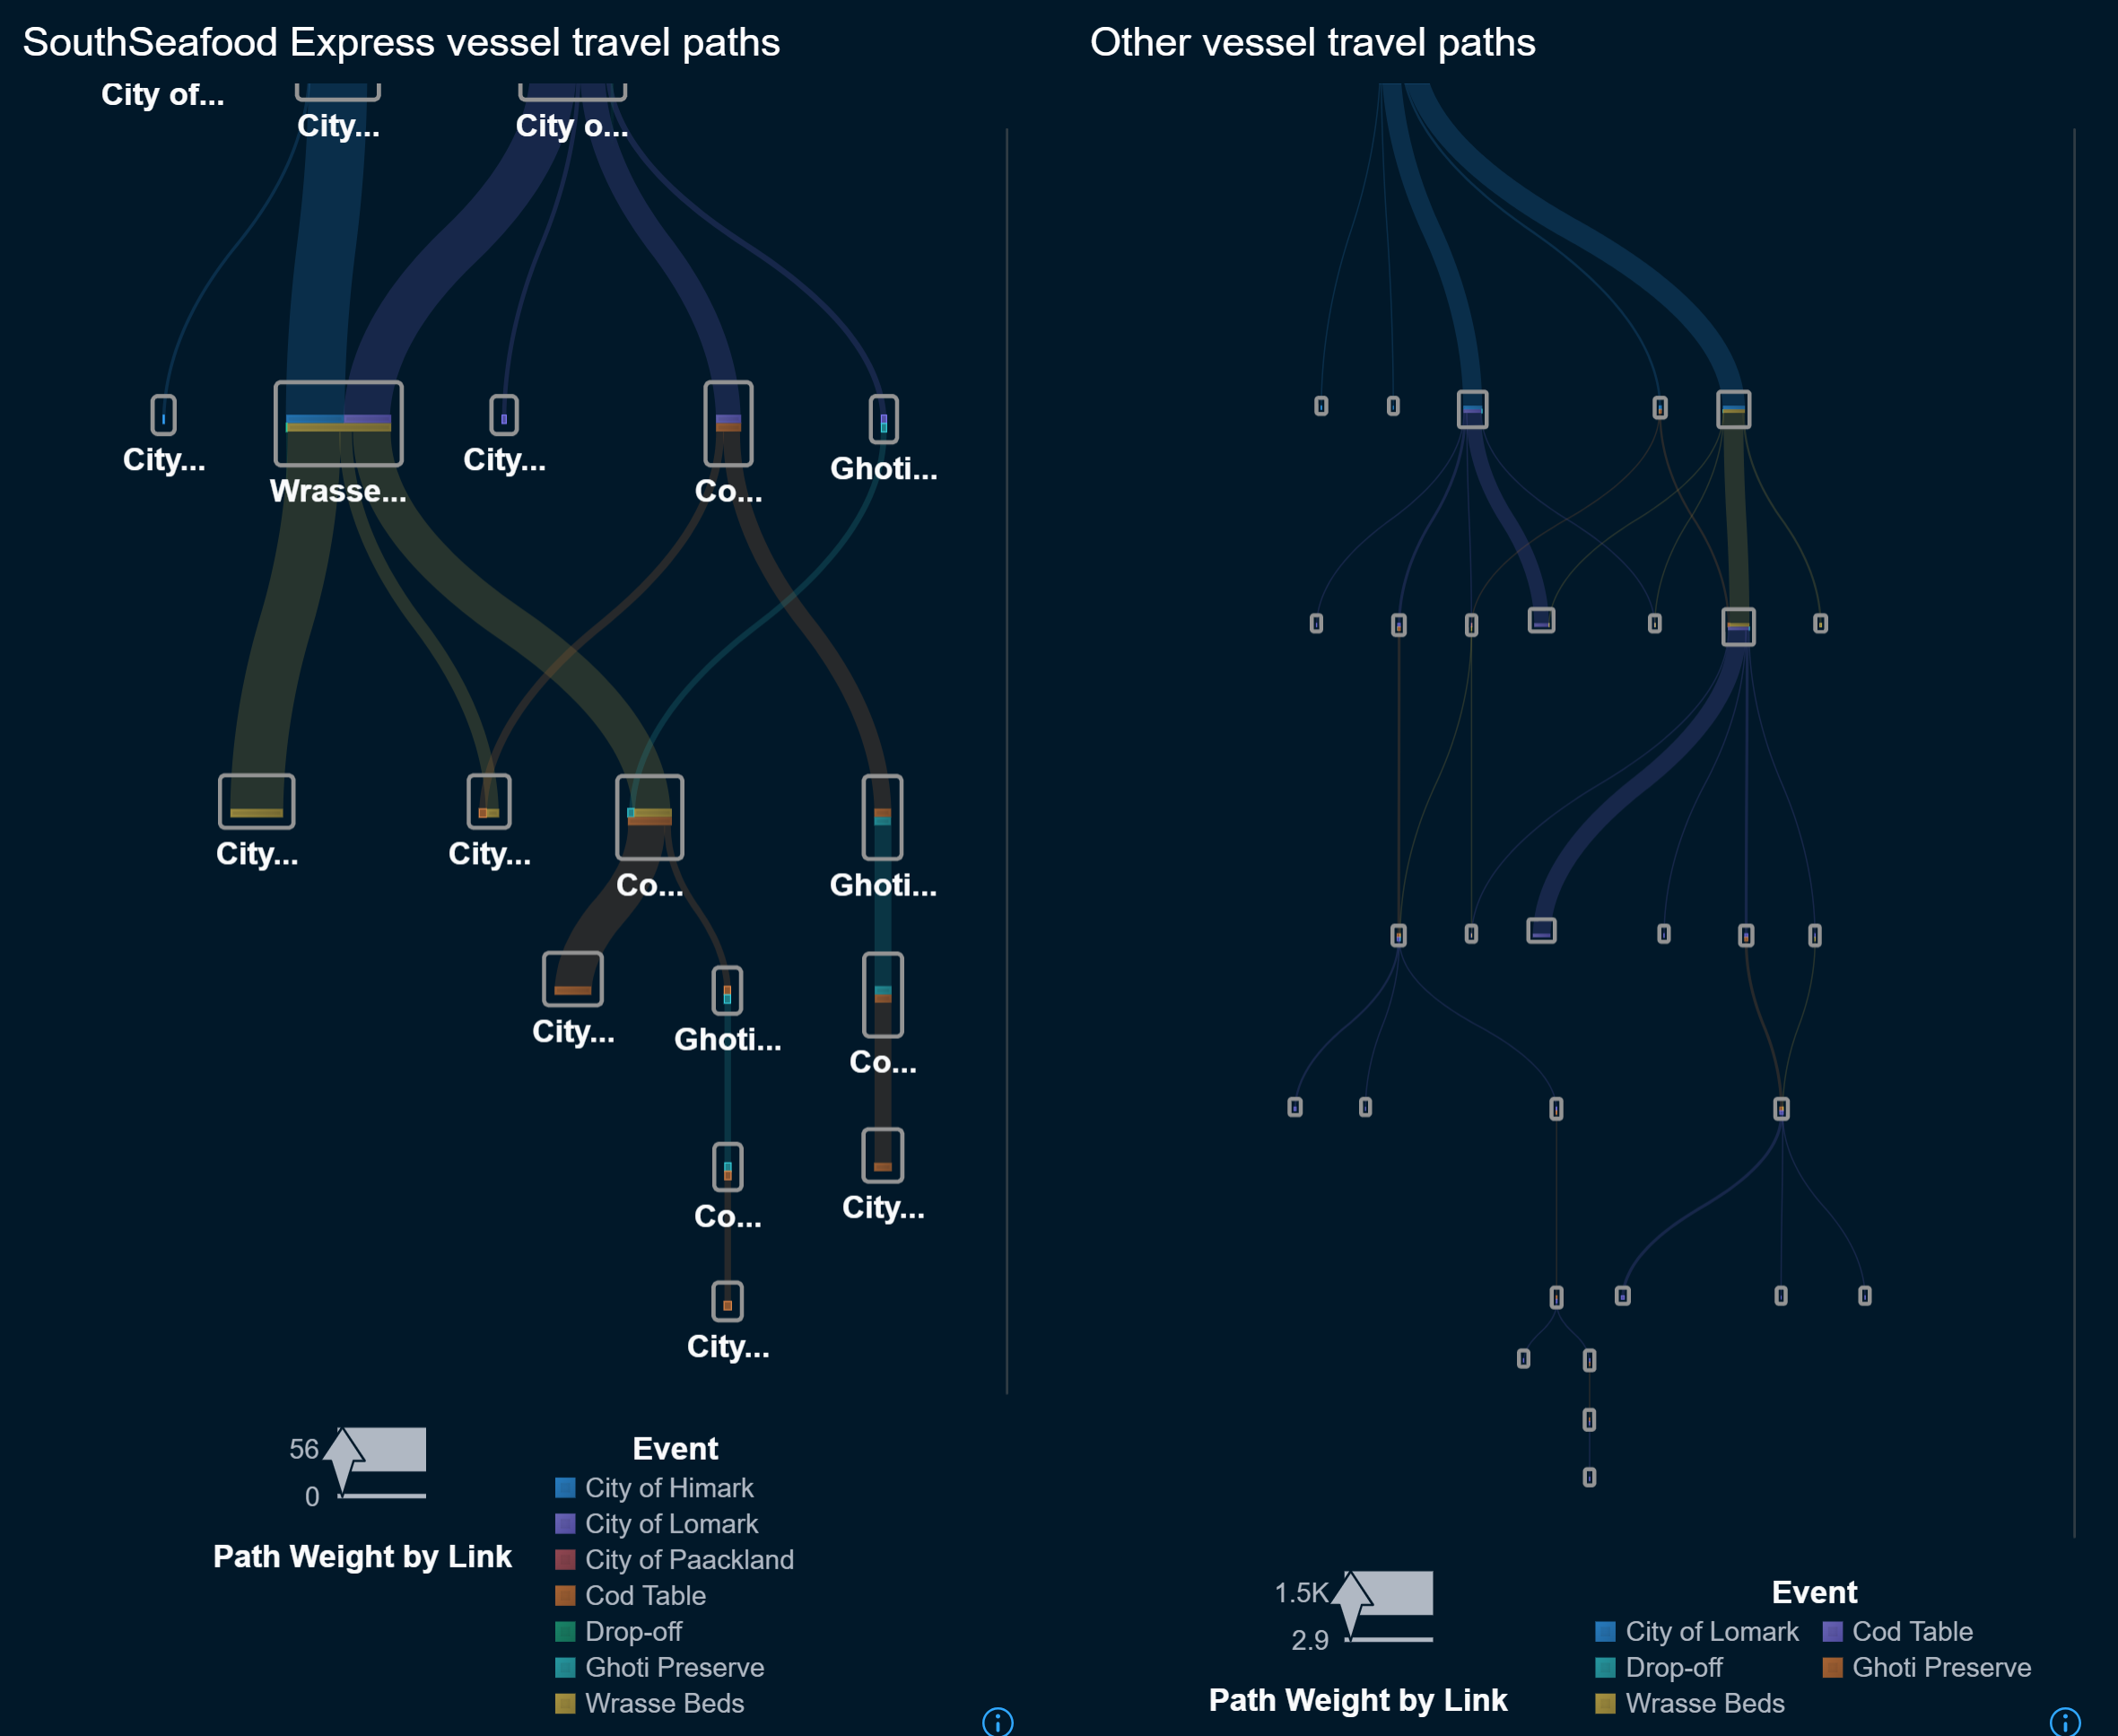
We matched vessels to commodities using SAS Viya's network analytics pattern match algorithm. To narrow down potential vessels for a cargo, we considered the vessel's movements and fish species available at locations visited before arriving at a harbor. The vessel also had to be present at the time of cargo export or up to one day earlier. The following visualization enables users to select a harbour and fishing location in order to examine related cargos and probable vessel matches. Although we don't always expect a single vessel match—since multiple vessels could deliver fish of the same species on a given day—the data does show a number of 1:1 matches.
2 Develop visualizations that illustrate the inappropriate behavior of SouthSeafood Express Corp vessels. How do their movement and catch contents compare to other fishing vessels? When and where did SouthSeafood Express Corp vessels perform their illegal fishing? How many different types of suspicious behaviors are observed? Use visual evidence to justify your conclusions.
Data provided, shows that SouthSeafood Express Corp owns two vessels:
- Roach Robber, a large 130m long and 11,700 t heavy ship
- Snapper Snatcher, a small 20m long and 100 t ship
SouthSeafood Express vessels typically start their journey in either the City of Himark or Lomark. Vessels typically fish in Wrasse Beds or Cod Table, two of the legal fishing grounds. Note, that there is no data available for the second half of the year, assumingly due to the company closure as a result of the illegal fishing acitivites.
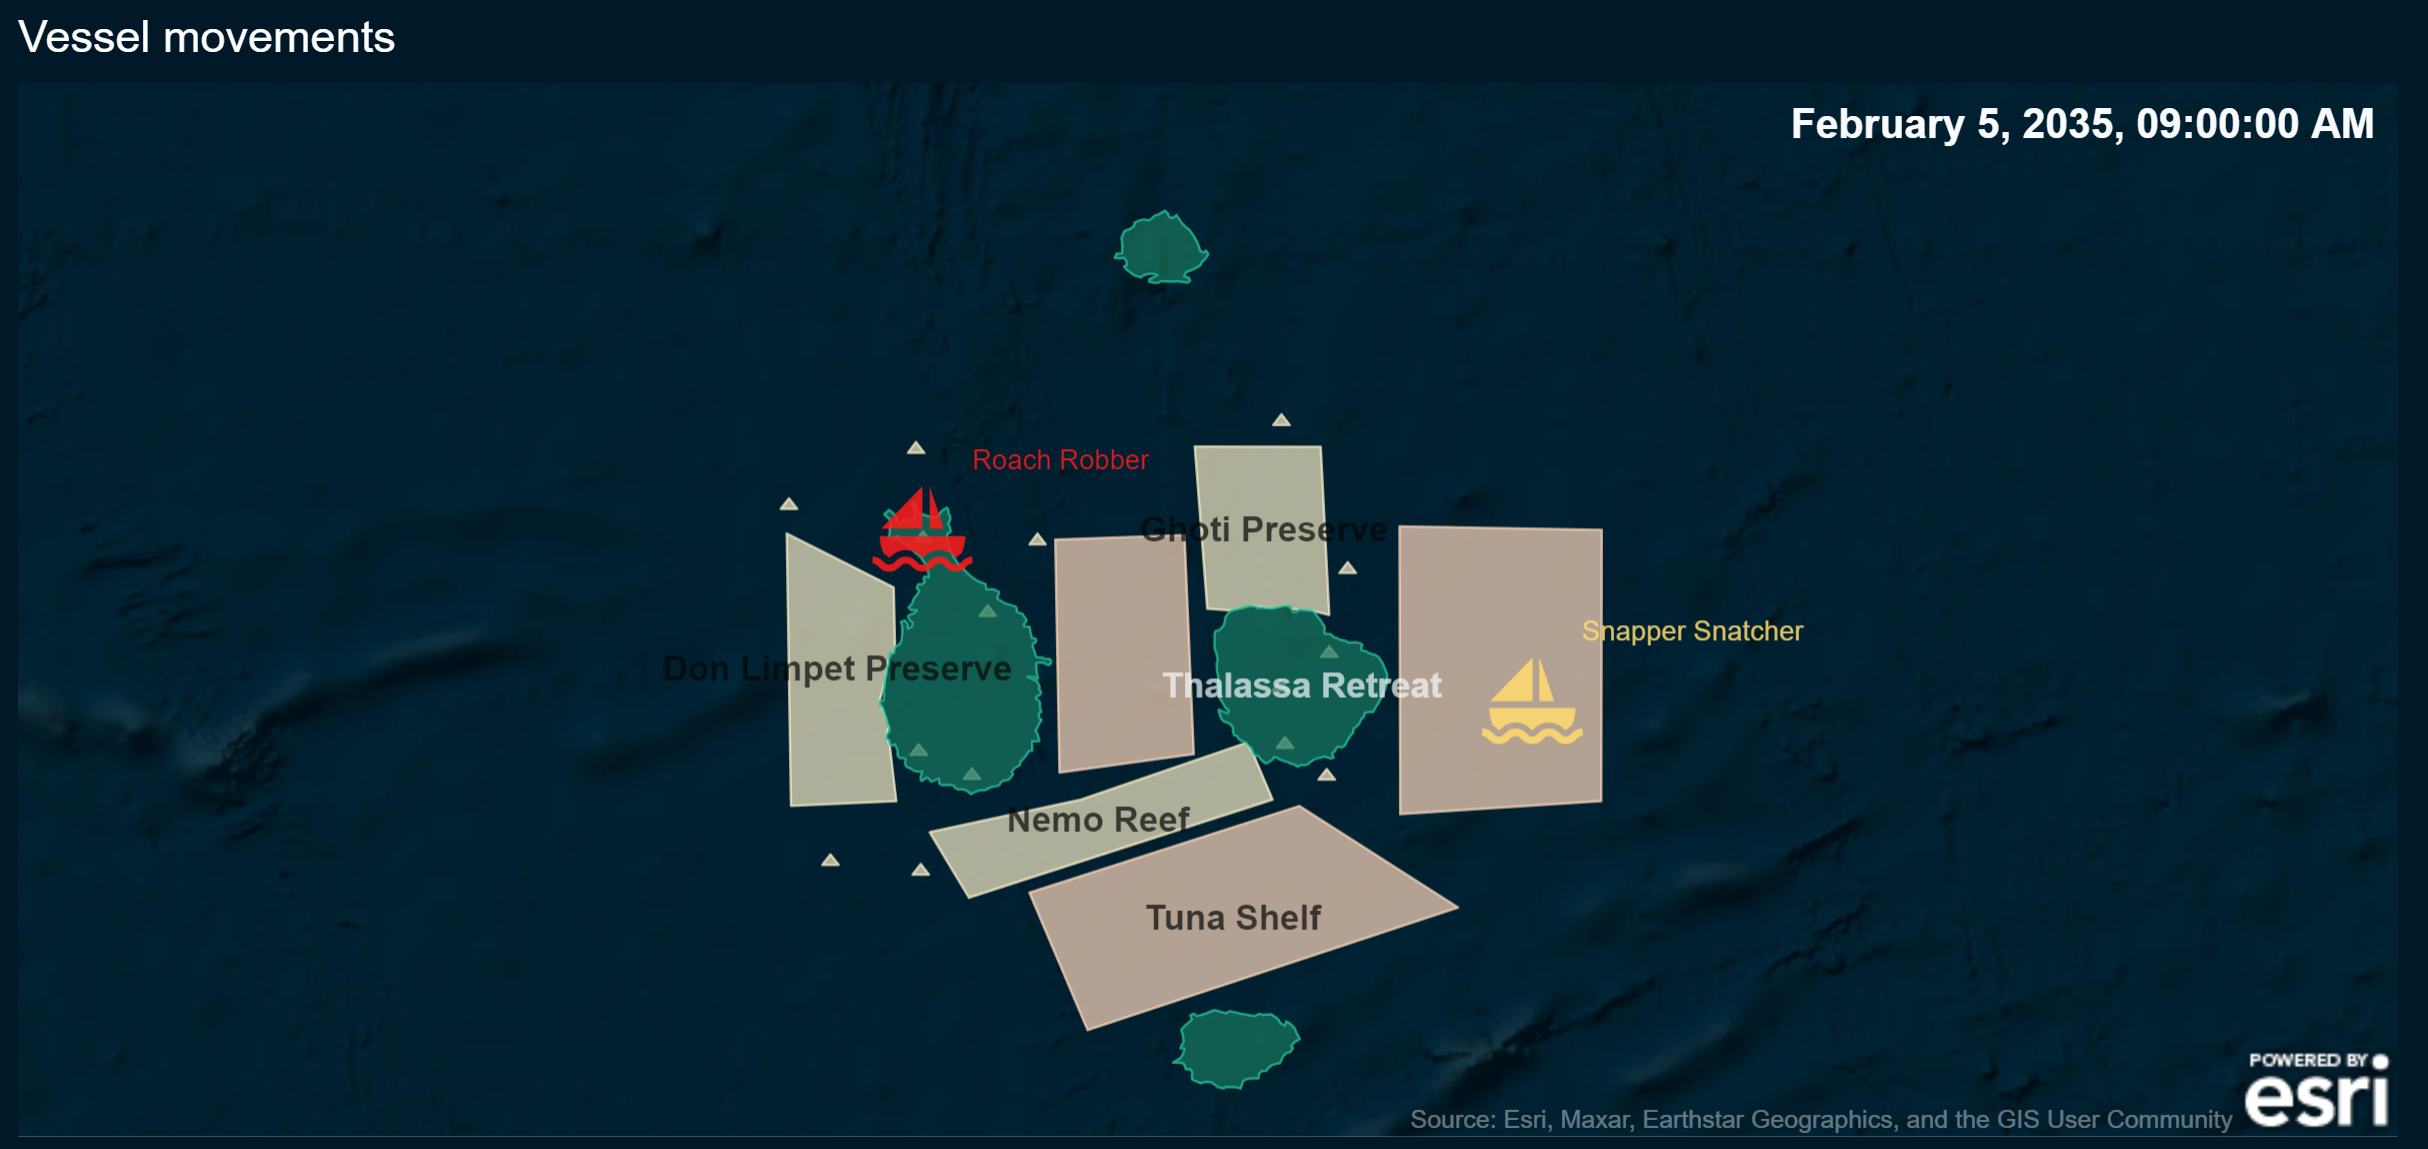
When and where did SouthSeafood Express Corp vessels perform their illegal fishing?
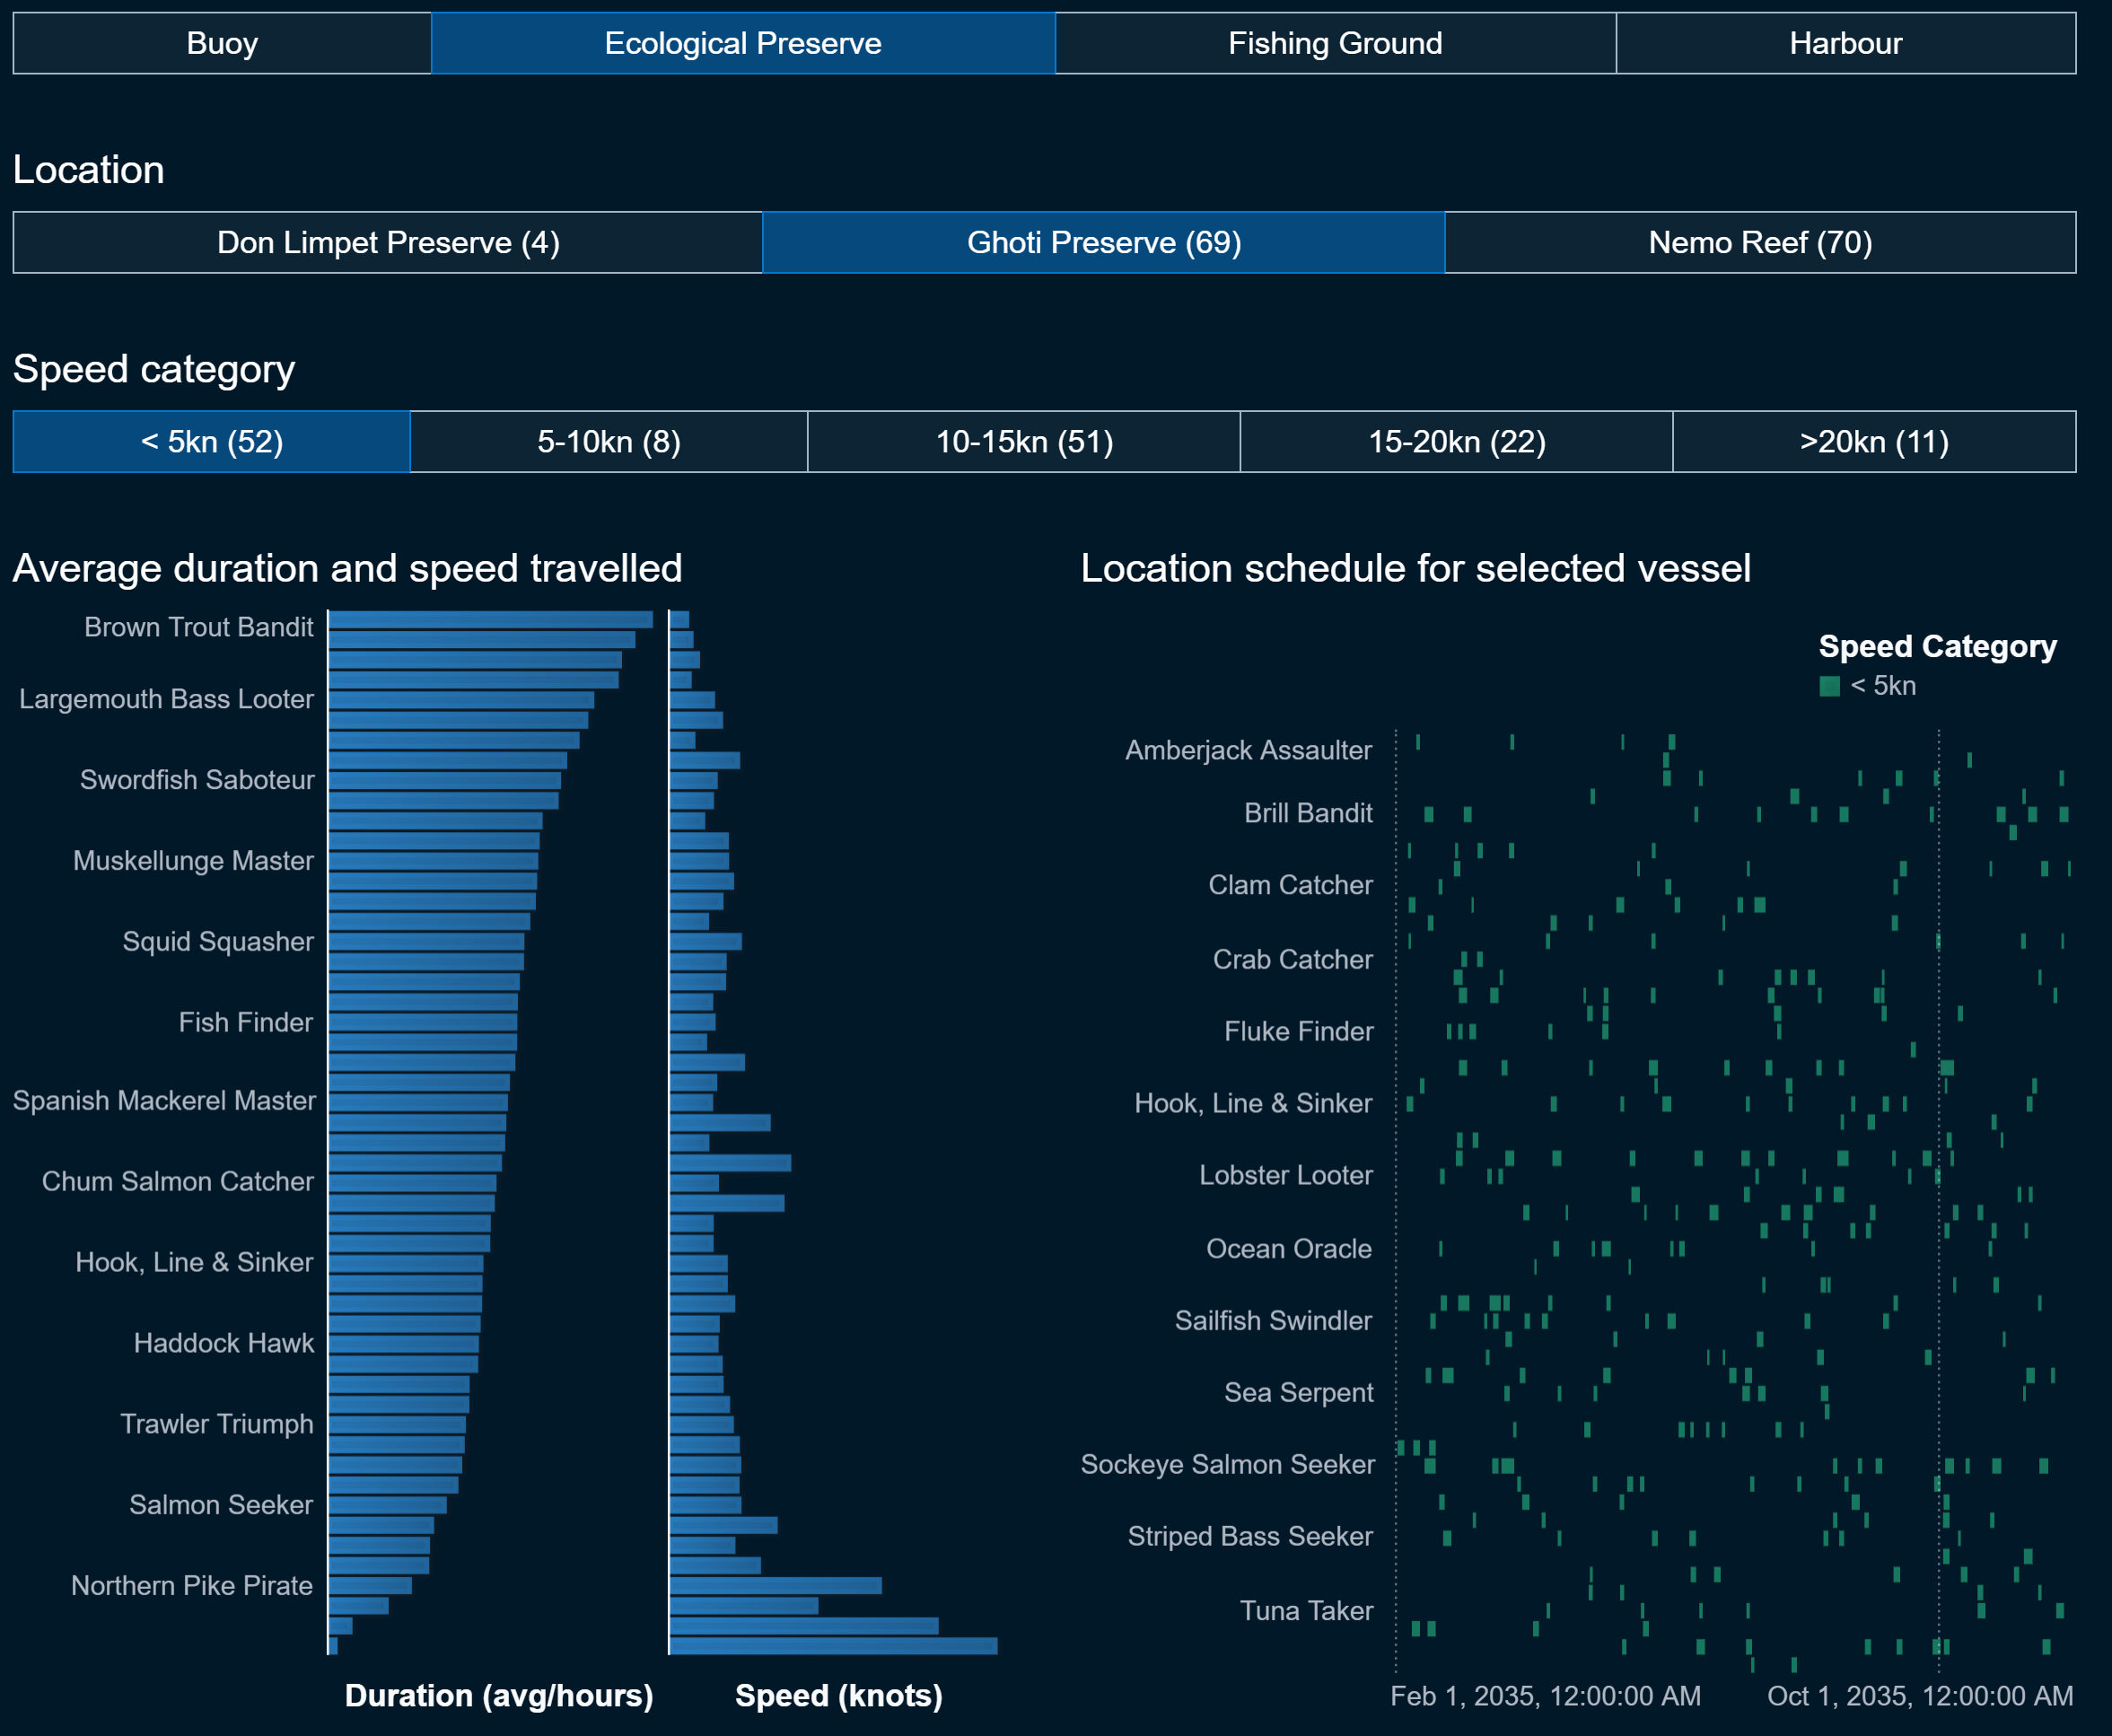
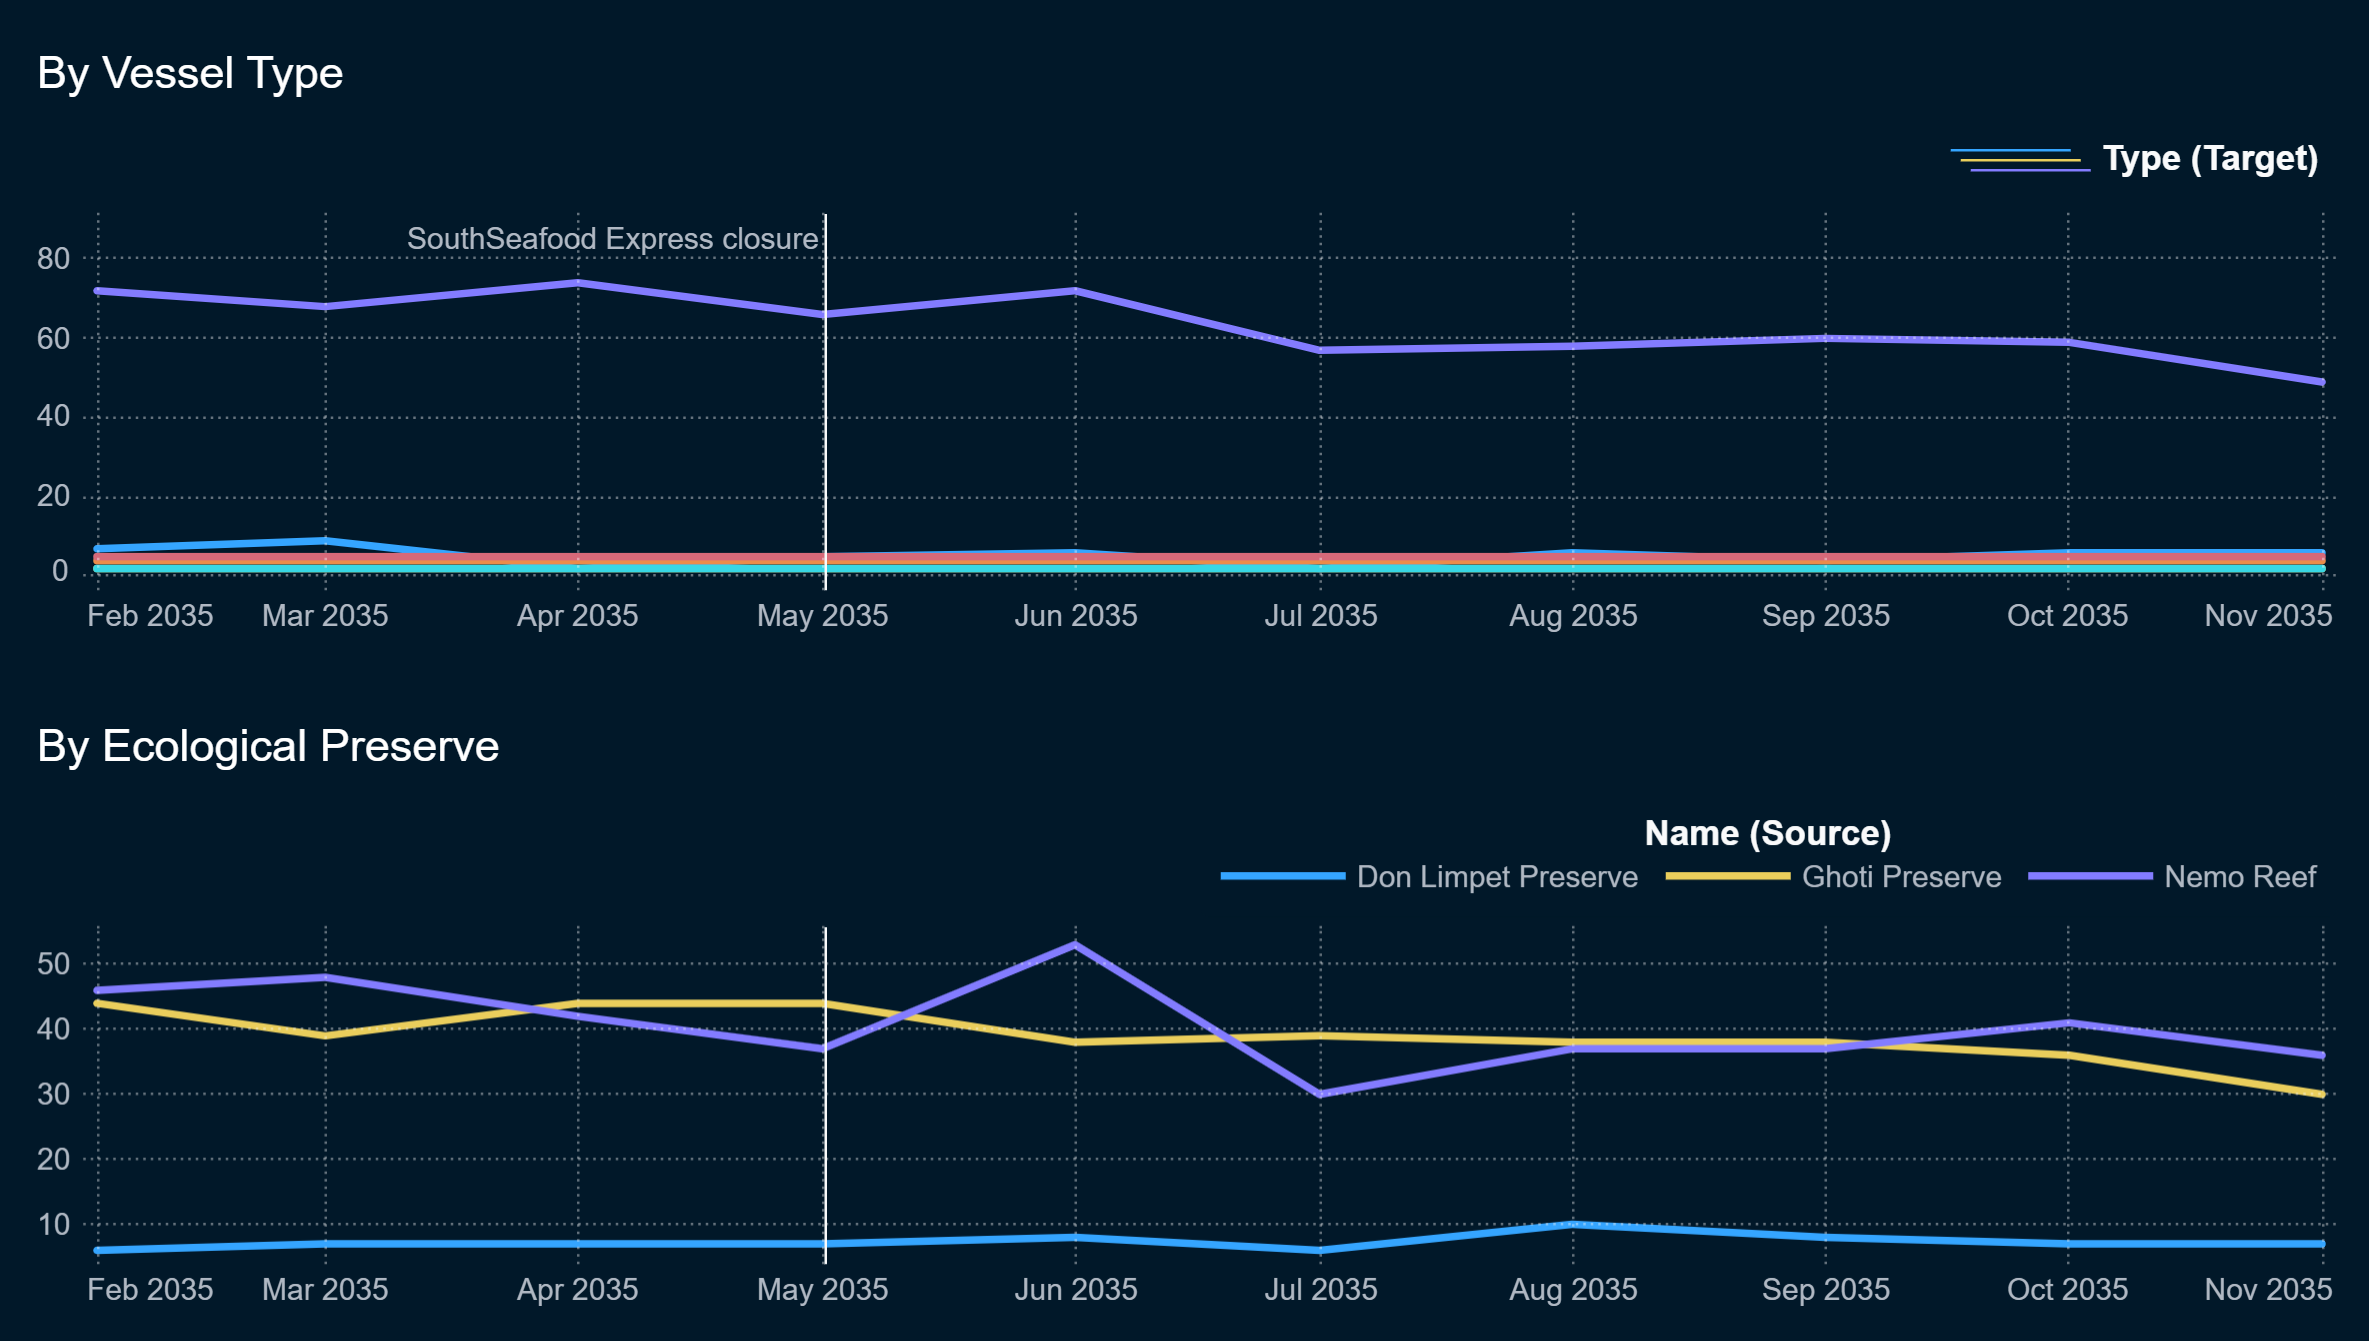
To gain a better understanding of vessel movement patterns, we analyzed the locations visited over a one-year period. While both vessels spent considerable time at Wrasse Beds fishing ground, a legal fishing area, the small vessel Snapper Snatcher was also recorded spending three consecutive days on multiple occasions at Ghoti Preserve, an ecological preserve. This could potentially indicate illegal fishing activities. The three recorded events occurred from February 2nd to 5th, February 9th to 12th, and February 16th to 19th, with an additional short visit of two hours on March 15th.
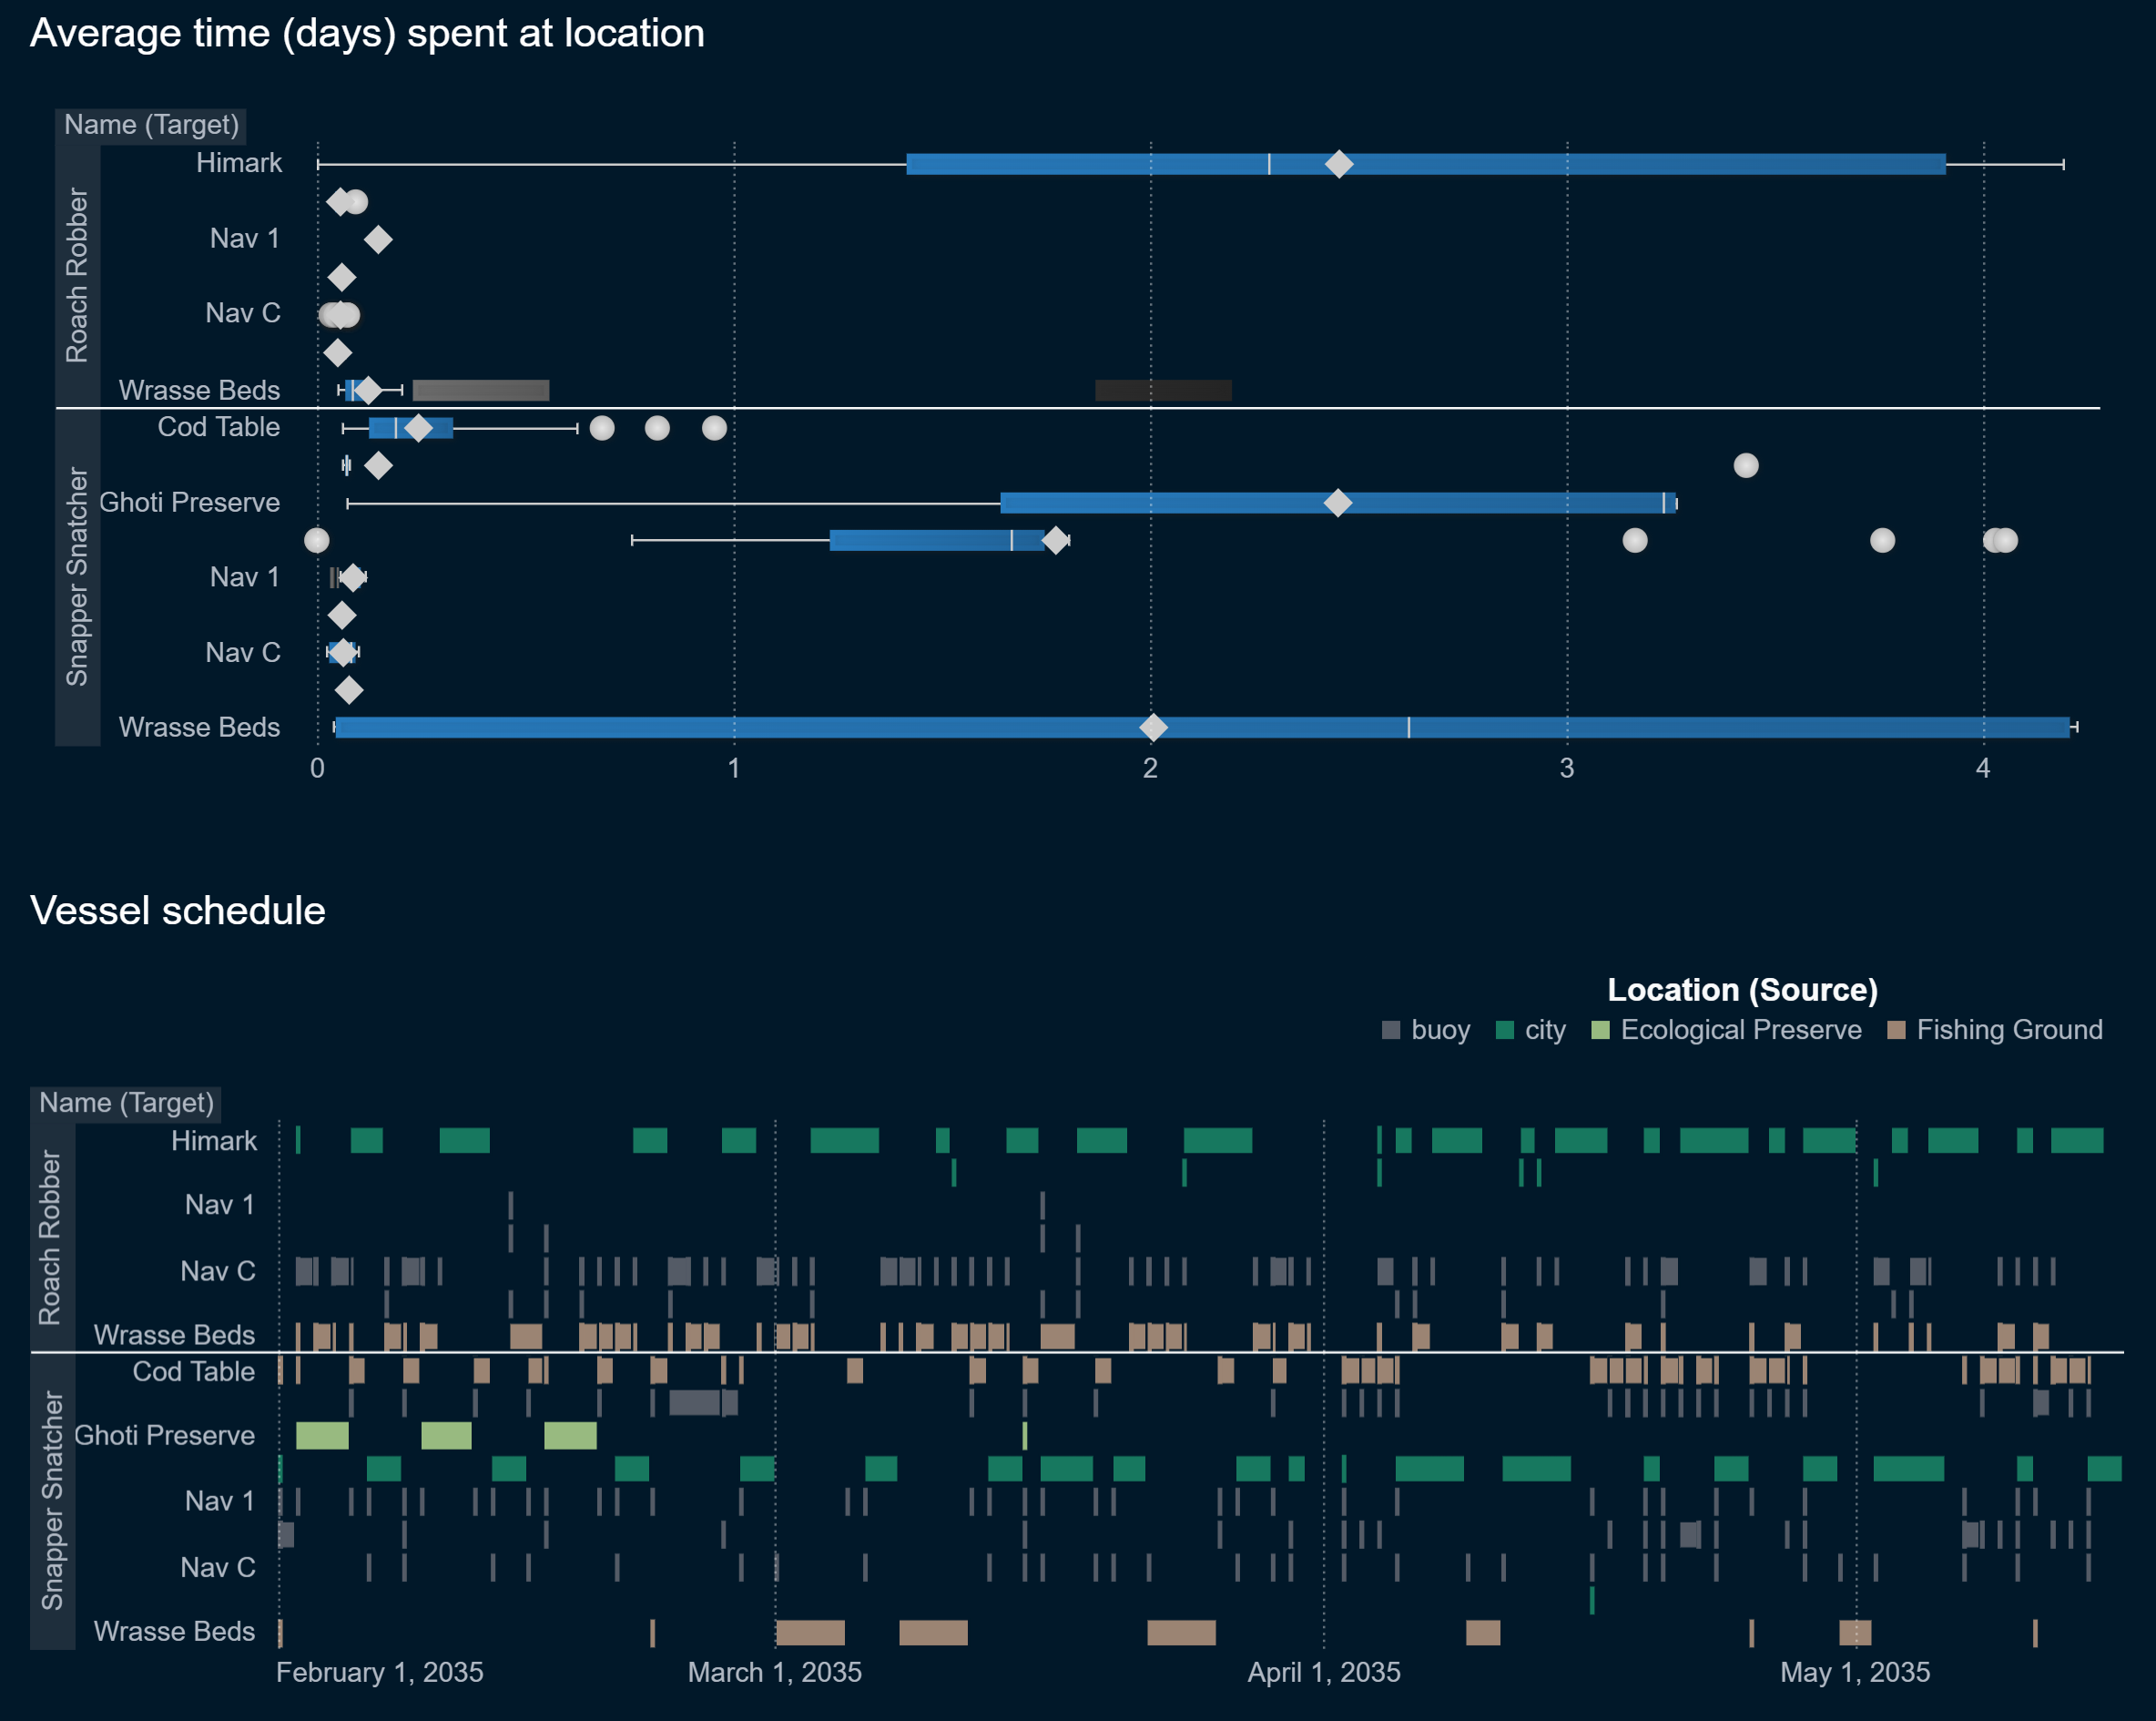
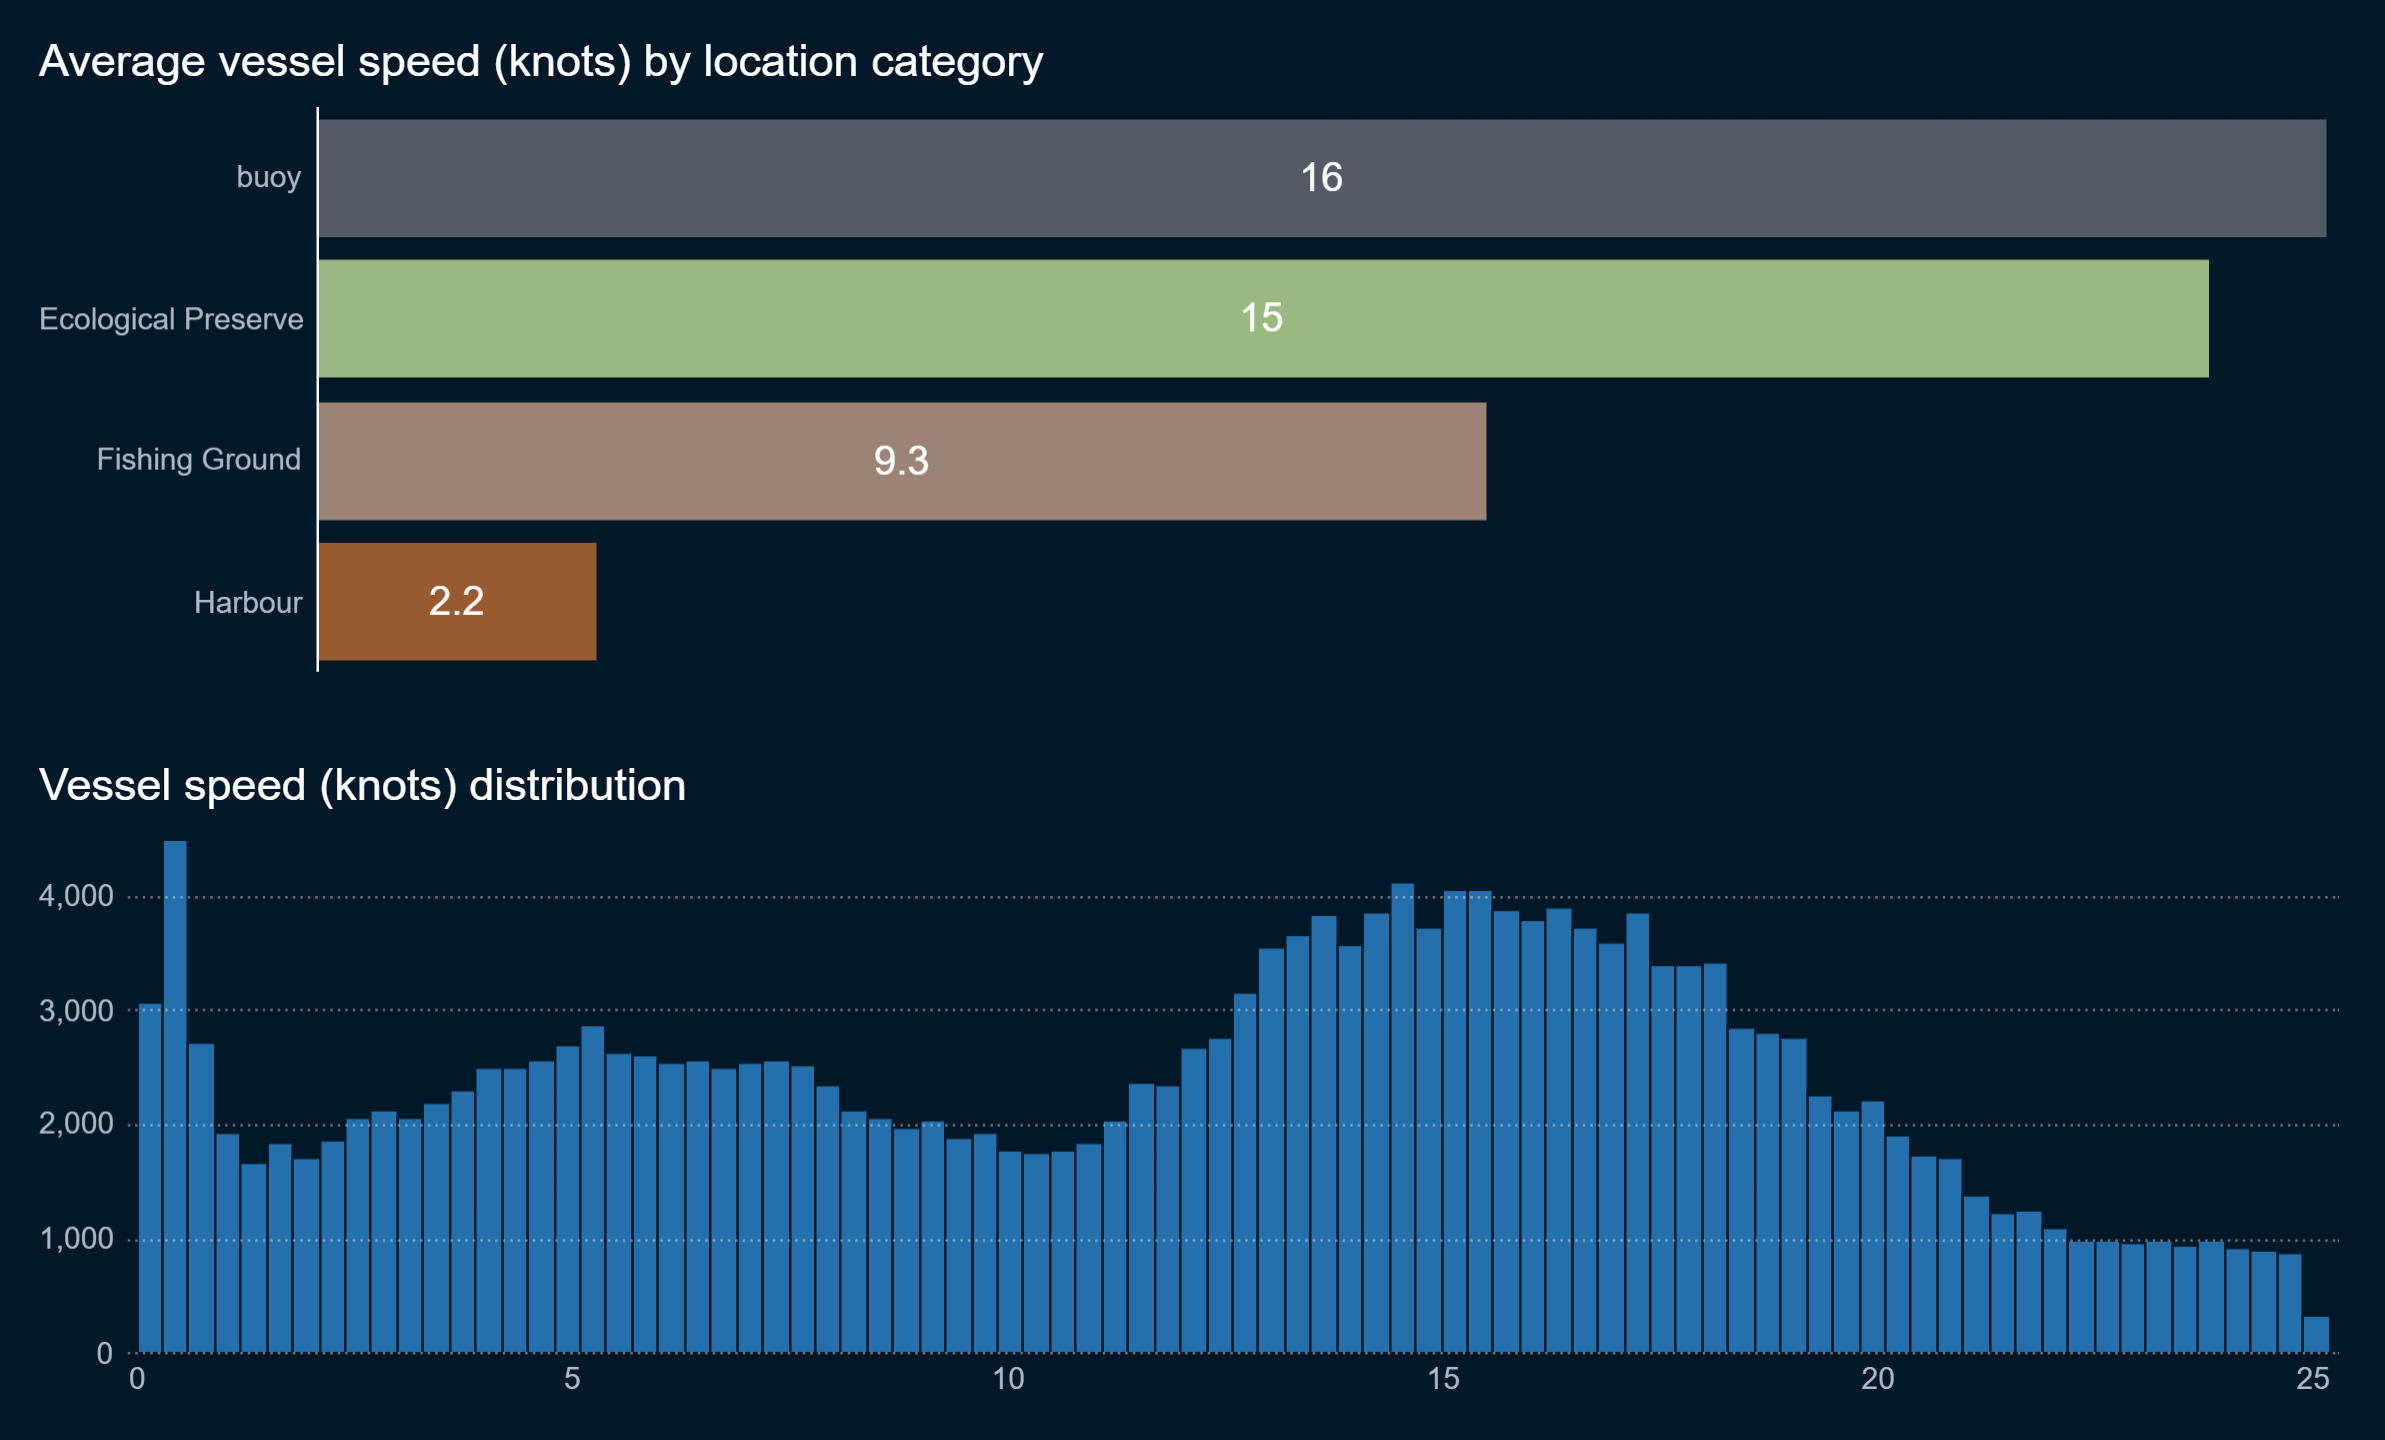
To more accurately determine the activities of a given vessel, we analyzed its movement and speed data. Using the GPS transponder signal, we obtained information about the vessel's location and time, allowing us to calculate the speed needed to reach various destinations. By examining the speed at different types of locations, we expect higher speeds at navigational points and ecological preserves, as these are typically transit areas. Lower speeds would suggest fishing activities. When examining the speed distribution for ecological preserves, we found that most vessels travel at high speeds. However, a small subset travels at 5 knots or slower.
By applying the speed data to the schedule chart for the SouthSeafood vessels, we observe that the Snapper Snatcher and other vessels travel at very low speeds in the Ghoti Preserve, indicating fishing activities. The fact that they stay at this location for three days warrants further analysis.
How many different types of suspicious behaviors are observed?
In addition to identifying suspicious behavior by Snapper Snatcher
regarding fishing in ecological preserves, we further investigated
transponder signals. Analyzing the detailed data and ping intervals
reveals blackout periods for both SouthSeafood vessels while traveling
in the Ghoti Preserve. For example, during all three visits to Ghoti,
CatchNet data shows a longer stay than what is measured using the GPS
transponder signal timestamps. Snapper Snatcher records an arrival at
the next navigation point (Nav 1) that is 7 hours earlier than expected.
Additionally, the second vessel, Roach Robber, has more than a day of
unaccounted records for Snapper Snatcher's third Ghoti visit on February
18th, potentially suggesting a secret meet-up for cargo exchange.
Hint: Select both of the SouthSeafood vessels and compare transponder
delays on Feburary 19th
3 To support further Fisheye investigations, develop visual analytics workflows that allow you to discover other vessels engaging in behaviors similar to SouthSeafood Express Corp’s illegal activities? Provide visual evidence of the similarities.
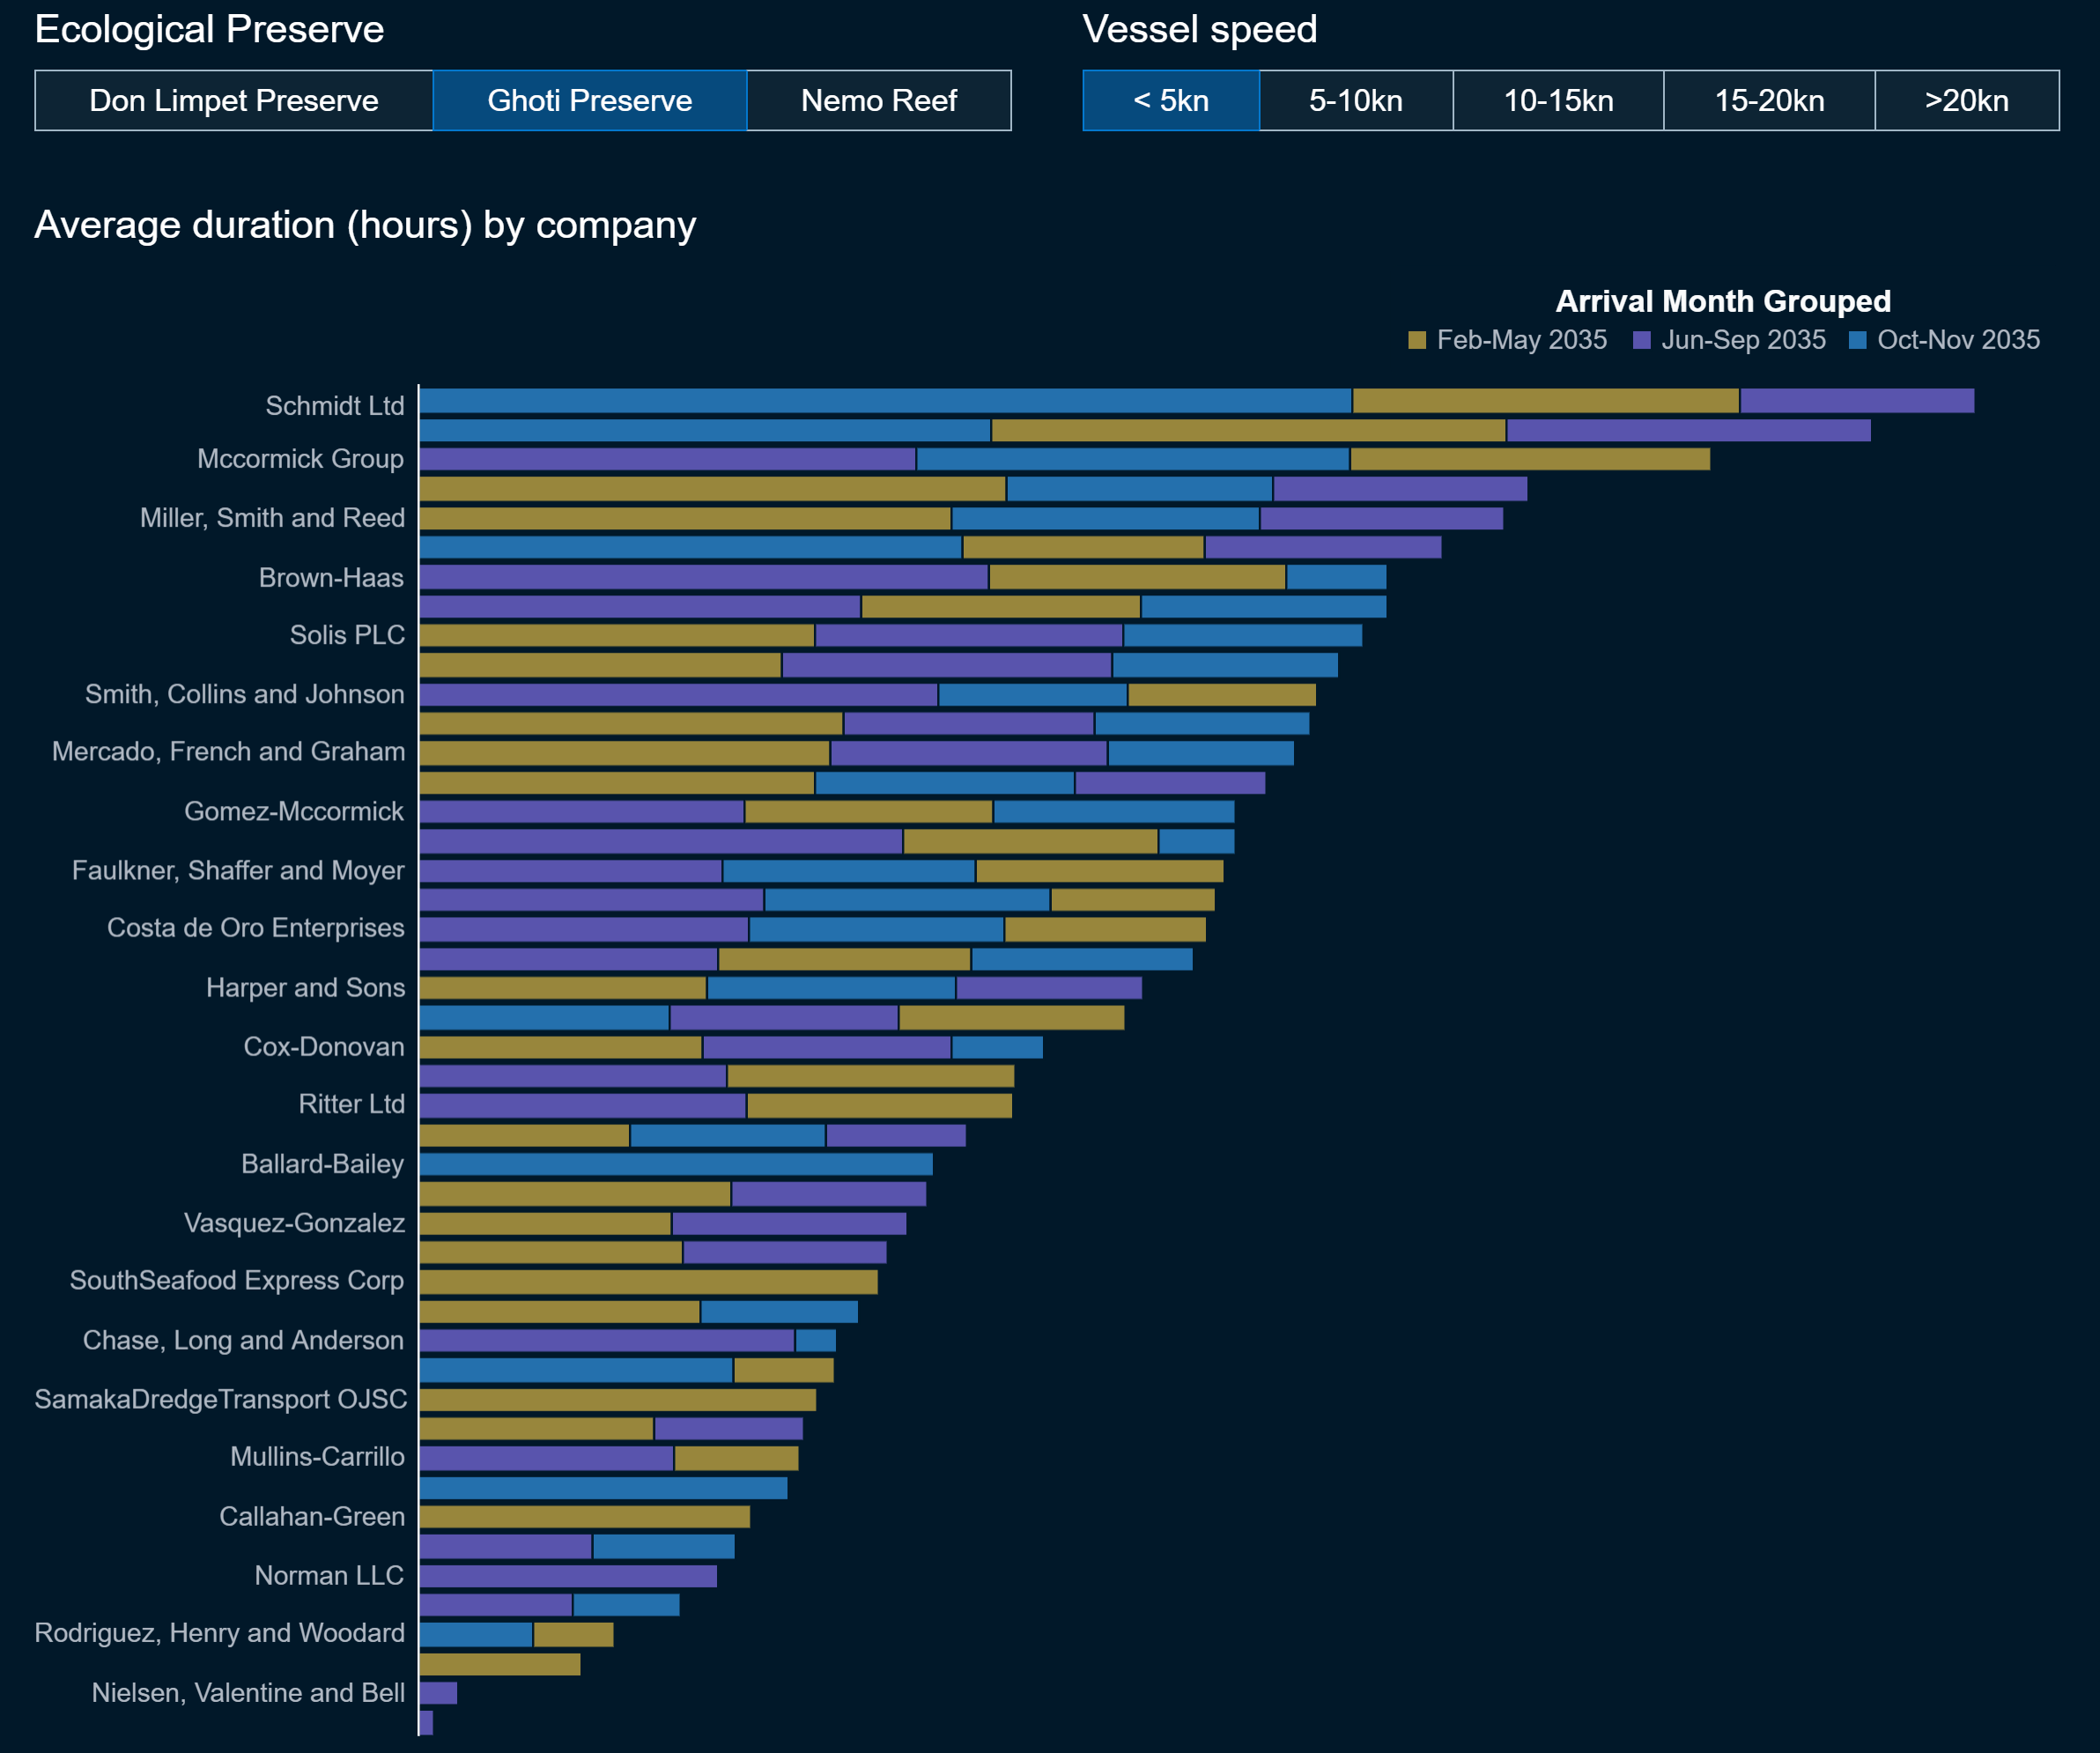
Given the knowledge that slow moving vessels in preserves may indicate illegal fishing activties, we can filter the data for other vessels across preserves. The following visualization shows vessel operators sorted by the average duration at the selected preserve.
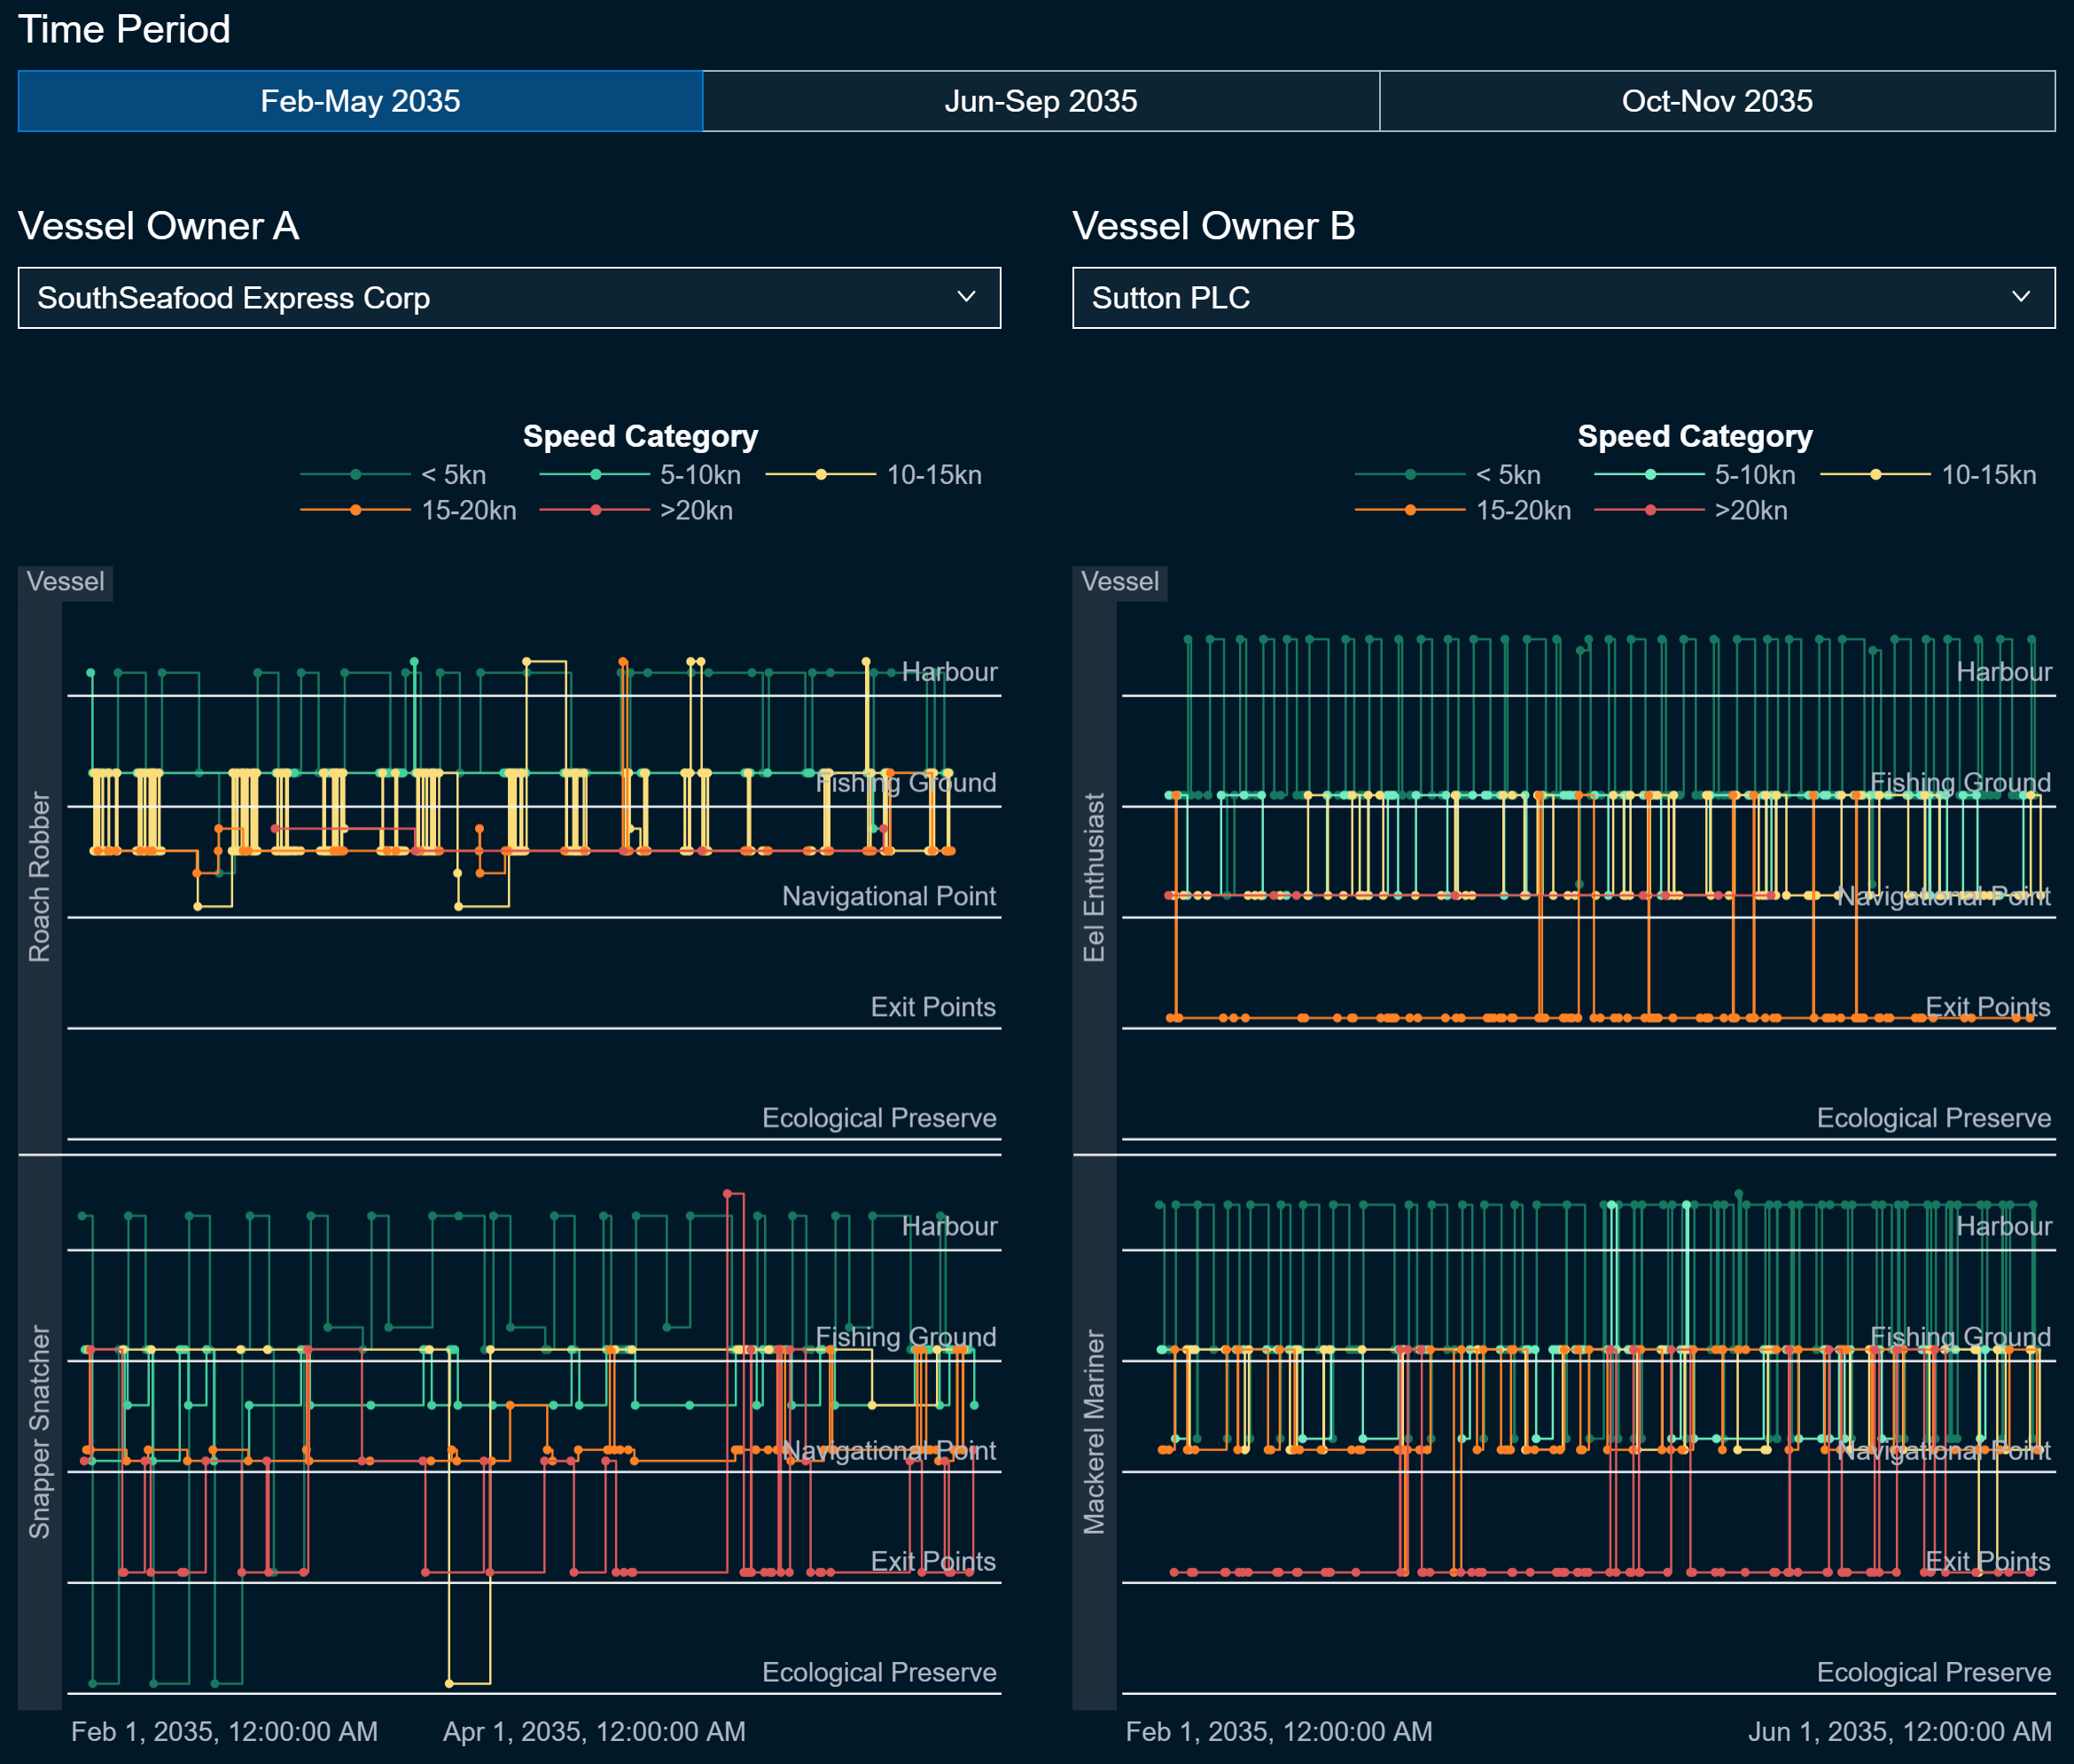
Every vessel traveling in Oceanus follows a temporal pattern based on its type and activities in the region. For example, this pattern helps distinguish fishing vessels from touring vessels. The following visualization enables a comparison of these patterns between two company vessels. A fishing vessel typically exhibits frequent loops between the harbor and fishing grounds, with the latter usually traversed slowly. High speeds are expected at navigational points and ecological preserves, as these represent transit waypoints.
4 How did fishing activity change after SouthSeafood Express Corp was caught? What new behaviors in the Oceanus commercial fishing community are most suspicious and why?
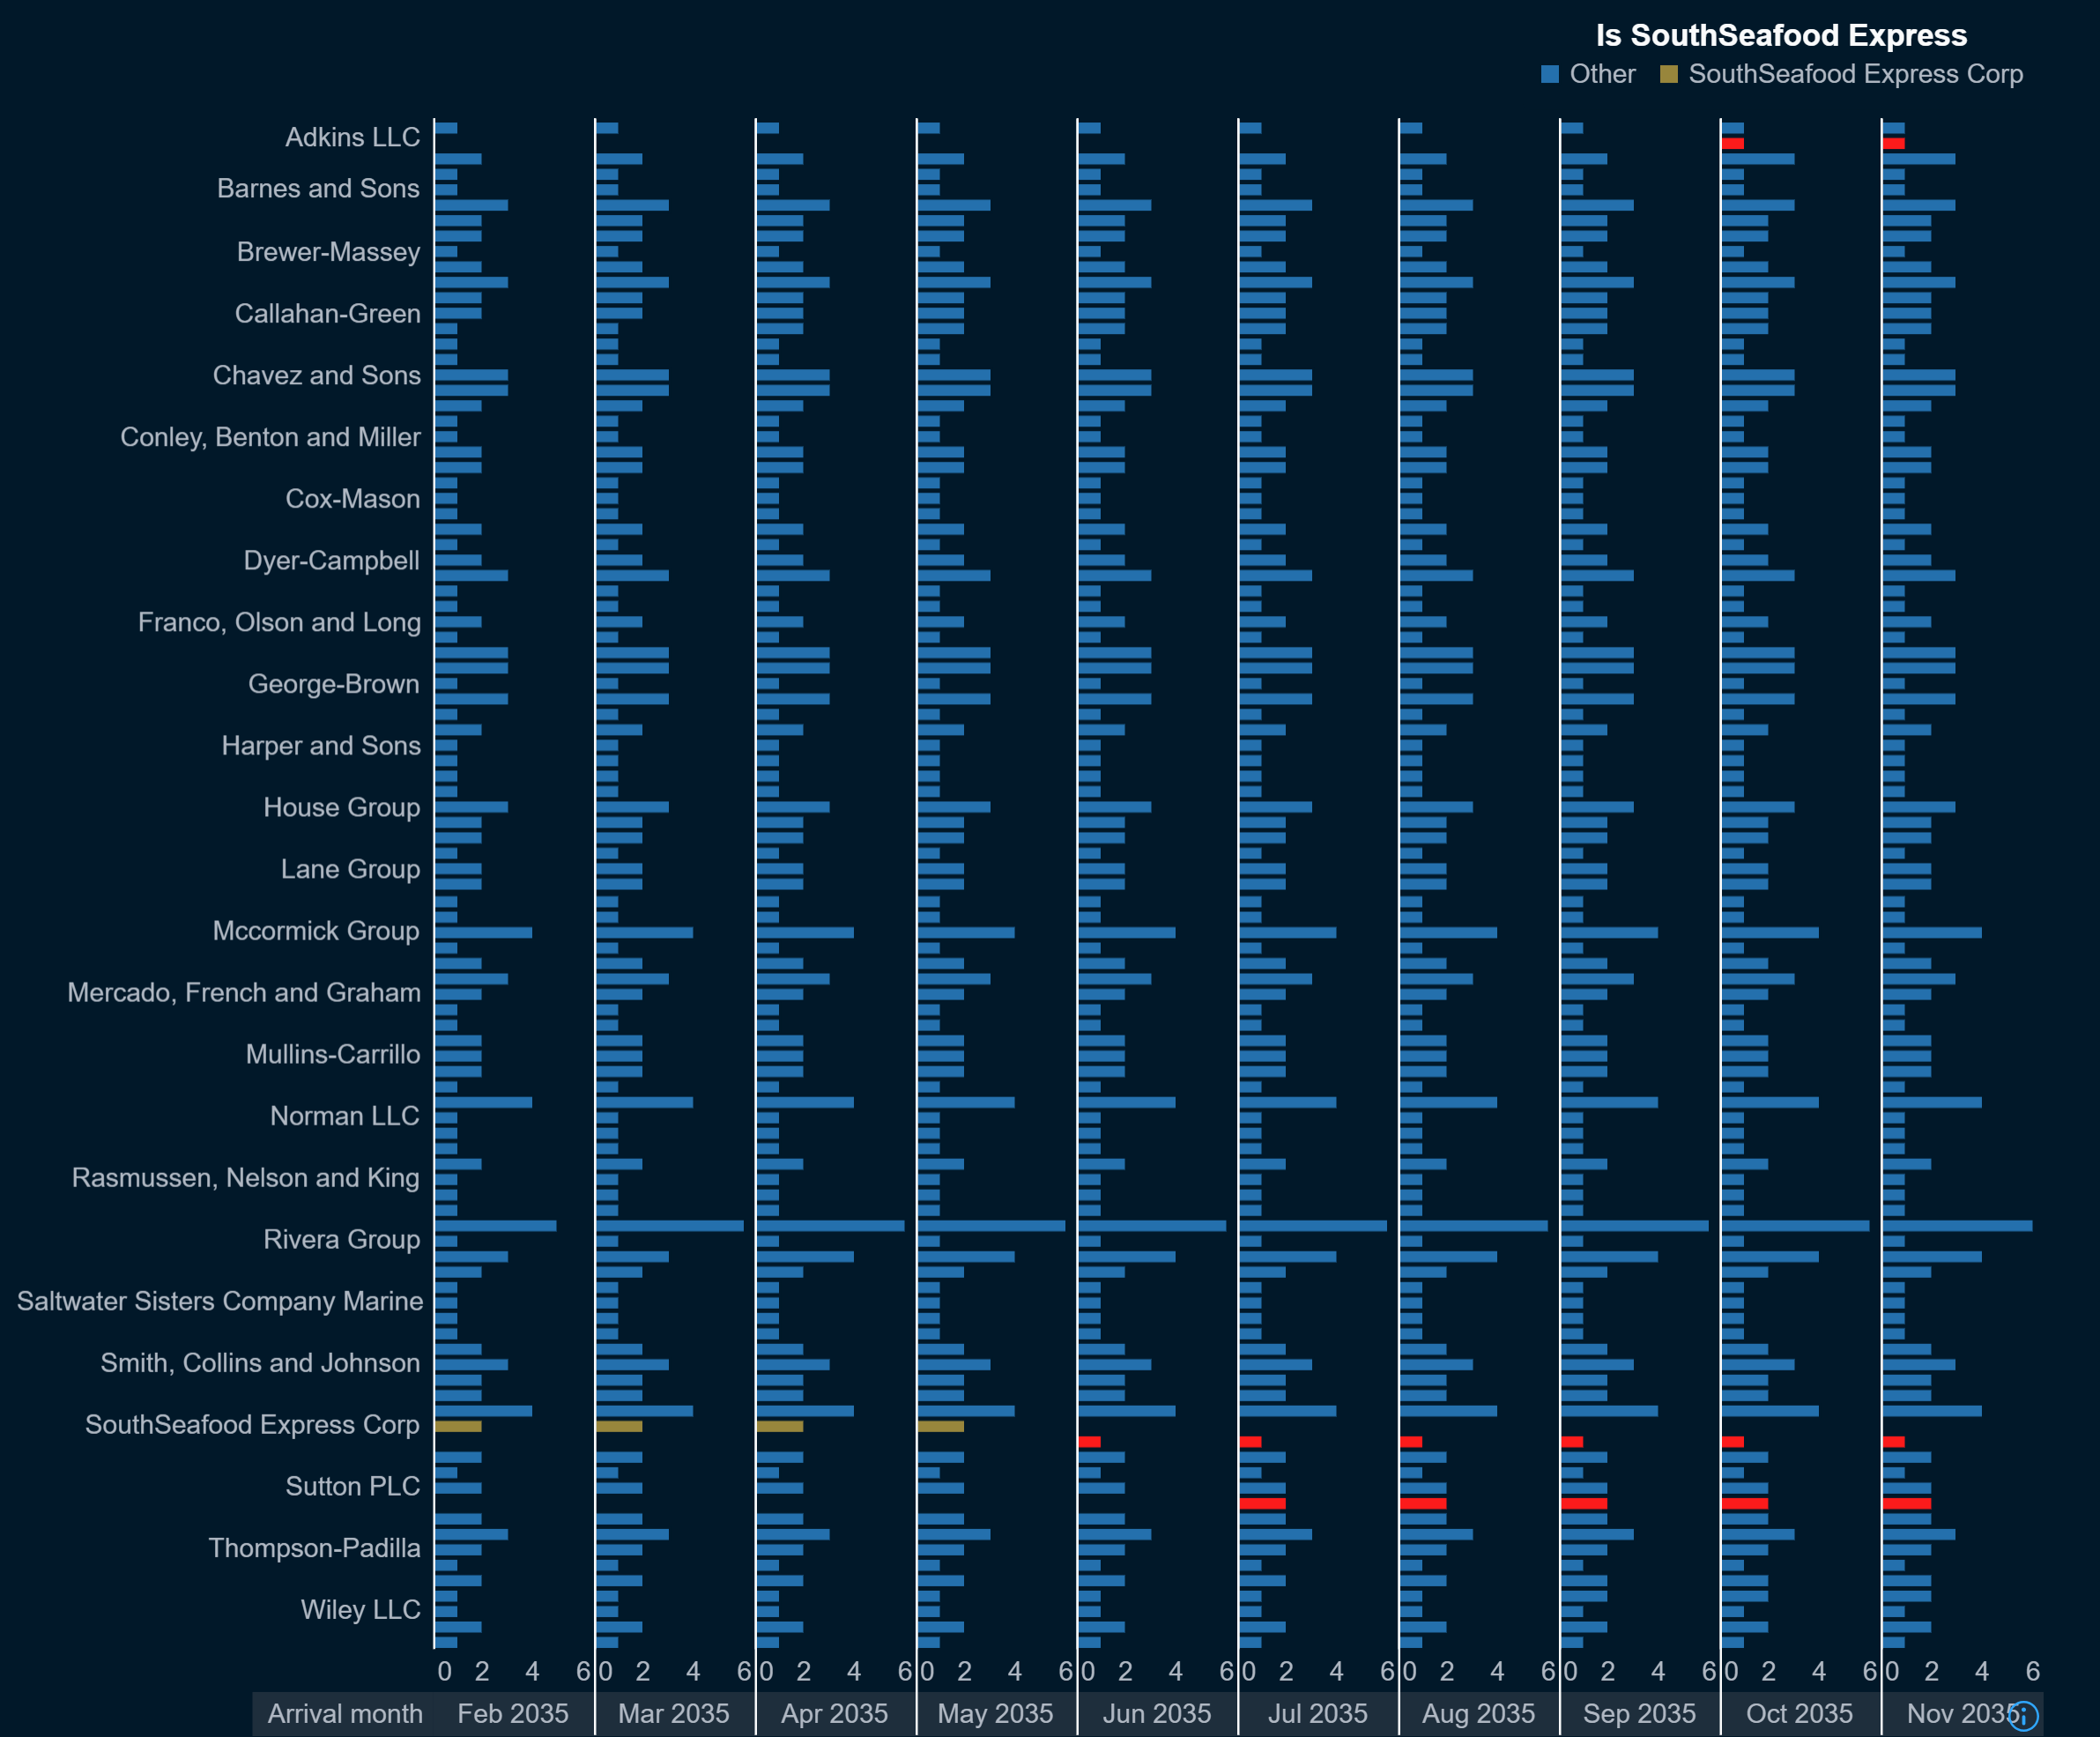
SouthSeafood Express Corp has been caught illegal fishing earlier in the year. As a result of the companies actions, data shows that none of the companies vessels operated after May 2035. Interesingly, new companies emerge in the months after (highlighted red), potentially warrant further analysis.
Analyzing vessel movements and the duration of their stays at specific locations provides insights into where vessels are located throughout the year. When focusing on visits to ecological preserves, there is a noticeable declining trend in stays of half a day or longer during the second half of the year. This decline may be linked to SouthSeafood's illegal fishing activities earlier in the year.
Analyzing cargo imports into Oceanus reveals that harbors process more frequent cargo imports in the second half of the year. However, the tonnage per cargo is lower, leading to a comparable overall fishing quantity. Interestingly, fish exclusively found in ecological preserves are only recorded after May, following the closure of SouthSeafood Express Corp. This suggests that records before this date might have been unreported.